XtremeMarkets

Market News

EUR/USD Drops Toward 1.1700 as US Dollar Strengthens; FOMC Minutes in Spotlight

The EUR/USD pair slid to around 1.1705 during Wednesday’s Asian session, weighed down by renewed strength in the US Dollar. The Euro came under pressure following fresh tariff threats from former US President Donald Trump, which unsettled global markets and added to investor caution. 

Trump reignited global trade concerns by proposing a 50% tariff on copper imports and hinted at possible duties on semiconductors and pharmaceuticals. While he mentioned that negotiations with both the European Union and China are progressing well, he also warned that a tariff notice to the EU could be issued within days. This uncertainty has dented risk sentiment, putting the Euro under additional stress. 

Attention now turns to the Federal Reserve’s meeting minutes, due later today. Market participants are hoping for more clarity on the Fed’s rate path, especially amid growing expectations of monetary easing. 

At its June meeting, the Fed held interest rates steady, maintaining the federal funds rate between 4.25% and 4.50%—a level unchanged since December. However, markets are now pricing in a total of 50 basis points in rate cuts by year-end, potentially beginning as early as October. 

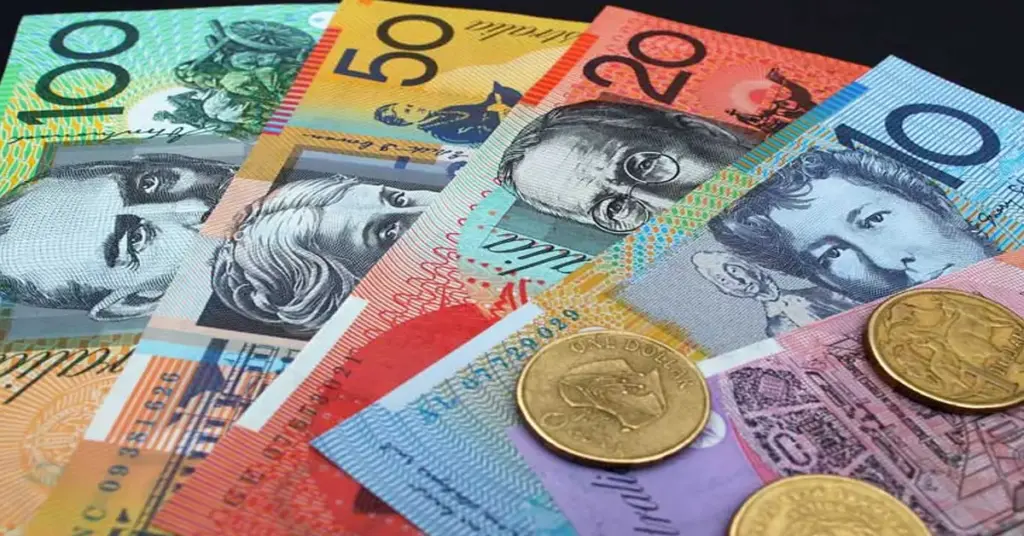
Australian Dollar Rises Amid Risk-On Sentiment, Focus Shifts to RBA Rate Decision

The Australian Dollar (AUD) continues its third straight session of gains against the US Dollar (USD) on Monday, following US President Donald Trump’s move to postpone the imposition of reciprocal tariffs. A weaker USD following disappointing US retail sales data has further supported the AUD/USD pair, reigniting speculation that the Federal Reserve (Fed) may cut interest rates later this year despite persistent inflation concerns.

Yet, the AUD’s gains could be capped before the Reserve Bank of Australia’s (RBA) policy announcement on Tuesday, as mounting speculation of a cut in interest rates deters sentiment. The RBA is widely expected to lower its Official Cash Rate (OCR) by 25 basis points (bps) to 4.10%, marking the first rate reduction in four years.

US Dollar Under Pressure Amid Lower Treasury Yields

The US Dollar Index (DXY) is down for the third consecutive session, bogged down by weaker US Treasury yields. At the time of writing, the DXY is trading around 106.70, with 2-year and 10-year Treasury bond yields at 4.26% and 4.47%, respectively.

Statistics released by the US Census Bureau on Friday indicated that US Retail Sales decreased 0.9% in January, a reversal from a revised 0.7% rise in December (earlier reported as 0.4%). The decrease was deeper than the market expectation of a 0.1% decline.

Conversely, Core PPI inflation in the US increased to 3.6% YoY in January, above expectations of 3.3%, though marginally less than the revised 3.7% (initially published as 3.5%). This has consolidated expectations that the Fed will push rate cuts until the second part of the year.

The US Consumer Price Index (CPI) rose 3.0% YoY in January, beating expectations of 2.9%, and core CPI (excluding food and energy) went up to 3.3% from 3.2%, beating expectations of 3.1%. On a month-on-month basis, headline inflation rose 0.5% in January compared to 0.4% in December, with core CPI rising to 0.4% from 0.2% in the same period.

Fed Officials Signal a Cautious Approach to Rate Cuts

In his semi-annual report to Congress, Fed Chair Jerome Powell stated that policymakers “do not need to be in a hurry” to cut interest rates, citing a strong labor market and robust economic growth. Powell also warned that Trump’s tariff policies could exert upward pressure on inflation, making it harder for the central bank to lower rates.

A Reuters poll of economists now indicates the Fed will wait until next quarter to cut rates, citing ongoing inflationary concerns. Although previously, some analysts anticipated a March rate cut; the majority now sees at least one rate cut by June, but opinions remain divided.

Federal Reserve Bank of Cleveland President Beth Hammack echoed this sentiment, saying that maintaining rates at current levels for a long time is probably the right thing to do. Hammack added that a patient strategy will enable the Fed to evaluate economic conditions before altering policy.

Australian Dollar Targets Upper Range Near 0.6400

The AUD/USD currency pair quotes at 0.6360 on Monday, with an uptrend in a rising channel formation. This is indicative of a bullish market inclination, which is also complemented by the 14-day Relative Strength Index (RSI) remaining above 50.

On the upside, the pair could test the upper boundary of the ascending channel at 0.6380, followed by the psychological level of 0.6400.

Major levels of support are the nine-day EMA at 0.6310, followed by the 14-day EMA at 0.6294. A fall below these levels may erode short-term momentum, possibly pulling the pair down to the lower boundary of the rising channel at 0.6270.

Australian Dollar Declines as US Dollar Holds Gains Ahead of Jobless Claims

The Australian Dollar (AUD) fell against the US Dollar (USD) on Thursday as trade balance data came in below average than expected. Furthermore, risk-off sentiment, fueled by rising US-China trade tensions, weighs on the AUD/USD.

In December, Australia’s trade surplus fell to $5,085 million, falling short of the 7,000 million anticipated and down from $6,792 million the previous year. While exports increased by 1.1% month on month, this was a decrease from November’s 4.2% increase, while imports increased by 5.9% month on month, much more than the previous 1.4% gain.

US-China Trade Tensions Weigh on Australian Dollar

Investors are still focused on the current trade stagnation between the United States and China, Australia’s top trading partner. China replied to the United States’ new 10% tax, which went into force on Tuesday, causing global market concern. Regarding the situation, President Trump announced on Monday that he intends to engage with China within the next 24 hours. However, he cautioned that failure to achieve an agreement might result in “very, very substantial” tariffs.

Meanwhile, China’s Commerce Ministry imposed a 15% tax on US coal and liquefied natural gas (LNG) imports, as well as an additional 10% levy on crude oil, farm equipment, and some autos. As a countermeasure, China has implemented export limits on important minerals such as tungsten, tellurium, ruthenium, and molybdenum, citing national security concerns.

Amid escalating trade tensions, the Financial Times writes that Chinese firms are quickening preparations to relocate production overseas, mainly to the Middle East, in order to reduce tariff impacts. Some exporters are also considering passing on prices to US consumers or expanding into new markets.

US Dollar Holds Firm Amid Mixed Economic Data

The US Dollar Index (DXY), which tracks the greenback’s performance against a basket of six major currencies, remains stable near 107.50, putting further downward pressure on the AUD/USD. The dollar’s resiliency comes after a weaker-than-expected US Services PMI fell to 52.8 in January, below the market forecast of 54.3.

Investors now focus on Friday’s US Nonfarm Payrolls (NFP) data, a key economic indicator that could influence the Federal Reserve’s monetary policy stance.

The dollar fell on Wednesday, following a poor US Services PMI report. The ISM Services PMI fell to 52.8 in January from a revised 54.0 in December, missing the market forecast of 54.3. Looking ahead, traders are anticipating Friday’s US Nonfarm Payrolls (NFP) report, which could influence the Federal Reserve’s future policy moves.

Technical Outlook: AUD/USD Pulls Back From 0.6300, Eyes Key Support

The AUD/USD pair hovers near 0.6280 on Thursday, retreating from the 0.6300 level. However, sustained trading above the nine- and 14-day Exponential Moving Averages (EMAs) suggests short-term bullish momentum remains intact. The 14-day Relative Strength Index (RSI) is also holding above 50, reinforcing the bullish bias.

On the upside, the pair might target 0.6330, its seven-week high from January 24.

Immediate support comes from the nine-day EMA near 0.6254, followed by the 14-day EMA at 0.6249.

A breach below these levels might weaken the bullish structure, potentially sending the pair below 0.6087, its lowest level since April 2020, which was recorded on February 3.

Australian Dollar Slips as US Tariffs on China Take Effect

The Australian Dollar (AUD) falls for the seventh consecutive day as the US Dollar (USD) strengthens following President Donald Trump’s 10% tariff on Chinese imports. Market volatility remains high as investors monitor the continuing US-China trade talks. Trump signaled he may speak with Chinese officials within the next 24 hours, warning that if a deal isn’t reached, tariffs on China will be “very, very substantial.”

Trump also announced a 30-day tariff relief for Mexico and Canada after their nations agreed to send 10,000 troops to the US border to battle drug trafficking. This move follows the introduction of 25% tariffs on Mexican and Canadian goods just two days before.

Chinese Exporters Seek Alternatives

According to the Financial Times, Chinese manufacturers are speeding up plans to transfer production offshore in reaction to US tariffs. Some companies are considering relocating to regions such as the Middle East, while others are looking into passing costs on to US customers or entering new markets.

RBA Rate Cut Expectations Weigh on AUD

The AUD faces additional pressure amid growing expectations that the Reserve Bank of Australia (RBA) may cut rates in February. The RBA has maintained the Official Cash Rate (OCR) at 4.35% since November 2023, stressing that inflation must return to its 2%-3% target range before easing policy.

Analysts at Westpac continue to forecast 100 basis points of rate cuts in 2025, with the market pricing in a more conservative outlook. ANZ, CBA, Westpac, and National Australia Bank (NAB) all anticipate a 25-basis-point (bps) cut in February, with NAB recently revising its forecast forward from May.

US Dollar Strengthens Amid Economic Developments

The US Dollar Index (DXY) stabilizes around 108.70 after erasing gains from the previous session. Recent US economic data support the greenback, with ISM Manufacturing PMI rising to 50.9 in January from 49.3 in December, exceeding expectations of 49.8.

Inflation indicators remain in focus as the Fed’s preferred measure, the Personal Consumption Expenditures (PCE) Price Index, rose 0.3% MoM in December, up from 0.1% in November. Annual PCE inflation increased to 2.6%, while core PCE held steady at 2.8% YoY for the third straight month.

Jerome Powell, Chairman of the Federal Reserve, highlighted that further policy adjustments would be required if there was clear evidence of inflation advance or labor market weakness. Separately, Treasury Secretary Scott Bessent recently argued for new uniform taxes on US imports, beginning at 2.5% and progressively increasing—a departure from his previous stance that tariffs cause inflation.

Australian Dollar Technical Analysis

AUD/USD trades around 0.6210 on Tuesday, remaining within a descending channel pattern on the daily chart, signaling a bearish bias. However, the 14-day Relative Strength Index (RSI) is recovering toward the 50 level, suggesting weakening downside momentum. A breakout above the channel, combined with an RSI move above 50, could indicate a shift toward a bullish outlook.

On the downside, the pair may test the descending channel’s lower boundary near 0.6150. A break below this level could drive AUD/USD toward 0.6087, its lowest point since April 2020.

AUD/USD is currently testing its initial resistance, the nine-day Exponential Moving Average (EMA) of 0.6225, which aligns with the channel’s upper limit. A decisive move over this level could fuel bullish optimism.


Japanese Yen Maintains Strong Bullish Momentum; USD/JPY Struggles Below 154.50

The Japanese Yen (JPY) continues to strengthen in early European trading on Thursday, pushing USD/JPY further below 154.50 and closer to its one-month low from earlier this week. Market expectations that the Bank of Japan (BoJ) will hike interest rates again by year-end continue to support the JPY. Additionally, a fresh decline in US Treasury bond yields, narrowing the US-Japan yield differential, has further boosted demand for the lower-yielding Yen.

However, concerns over the potential economic impact of US President Donald Trump’s trade policies may limit aggressive JPY buying. Meanwhile, the Federal Reserve’s (Fed) hawkish pause on Wednesday has bolstered the US Dollar (USD), which could provide some support to the USD/JPY pair. Traders are now looking ahead to the European Central Bank (ECB) meeting, which may increase market volatility and drive further demand for the safe-haven Yen. Additionally, the Advance US Q4 GDP report could introduce short-term trading opportunities.

JPY Gains on Hawkish BoJ Sentiment Amid Market Uncertainty

  • Minutes from the BoJ’s December meeting, released Wednesday, indicated discussions on using neutral interest rate estimates to guide future rate hikes.
  • Former BoJ board member Makoto Sakurai stated on Tuesday that steady rate increases remain feasible due to rising wages, sustained inflation, and strong economic growth.
  • The Federal Reserve, as expected, held rates steady after its two-day meeting and signaled no immediate plans for rate cuts.
  • Fed Chair Jerome Powell emphasized a patient stance, stating there is no urgency to adjust policy and reaffirming that rates will stay elevated amid concerns over Trump’s trade policies, which could fuel inflation.
  • The 10-year US Treasury yield has struggled to sustain gains post-FOMC due to uncertainty surrounding the Trump administration’s economic policies.
  • Reports from Asahi newspaper indicate that Japan’s Prime Minister Shigeru Ishiba is finalizing plans for a February 7 meeting with US President Donald Trump in Washington.
  • The ECB’s policy decision later today is expected to introduce further volatility, alongside the Advance US Q4 GDP print.

USD/JPY at Risk of Retesting Monthly Lows Near 153.70

The USD/JPY pair faced renewed selling pressure near the 156.00 level, breaking below the key 155.00 psychological mark, confirming a multi-month ascending channel breakdown. Momentum indicators on the daily chart suggest continued downside movement, making a retest of the 153.70 region—a multi-week low touched on Monday—a strong possibility.

Key resistance levels for a rebound:

  • 155.00 round figure
  • 155.35-155.40 region
  • 156.00 psychological level

Any recovery attempt is likely to face selling pressure near these levels. A sustained break above 156.25 could trigger short-covering, potentially lifting USD/JPY toward 156.70-156.75, with further resistance at 157.00 and 157.60.

For now, the bias remains bearish, with further losses expected if the pair stays below 154.00. Traders will closely watch US data and global central bank policy updates for the next directional move.

Gold Price Retreats from Multi-Month High Amid USD Recovery

Gold price (XAU/USD) faces selling pressure at the beginning of the week, pulling back from its highest level since late October, near the $2,786 mark touched on Friday. The US Dollar (USD) has staged a modest recovery following its worst weekly performance since November 2023, which has weighed on the precious metal. However, the broader market dynamics remain supportive of a bullish outlook, suggesting potential dip-buying opportunities at lower price levels.

Market Sentiment Dampened by Trade Tensions and Fed Speculation

Risk sentiment has deteriorated due to US President Donald Trump’s recent decision to impose tariffs on all imports from Colombia, reigniting fears of a trade war. Additionally, expectations that the Federal Reserve (Fed) may cut interest rates twice by year-end, combined with a flight to safe-haven assets, have triggered a fresh decline in US Treasury bond yields. This decline could limit aggressive gains in the USD, potentially cushioning the downside for gold, a non-yielding asset.

Gold Under Pressure from USD Recovery, but Downside Remains Limited

The US Dollar Index (DXY), which tracks the USD against a basket of currencies, rose nearly 0.25% on Monday, driven by revived concerns over US trade policies. President Trump ordered 25% emergency tariffs on all Colombian imports following the country’s refusal to accept deported migrants from the US, with a threat to raise tariffs to 50% next week. Moreover, reports suggest that Trump’s advisors are considering imposing 25% tariffs on Mexico and Canada starting February 1.

In a recent update, the White House confirmed that Colombia has agreed to Trump’s demands, including the unrestricted acceptance of deported individuals. Meanwhile, Trump has reiterated his call for immediate interest rate cuts, fueling speculation of further easing by the Federal Reserve in 2025. The resulting decline in US Treasury yields may act as a headwind for the USD, potentially limiting the extent of gold’s pullback.

Traders Eye Economic Data for Further Clues

Market participants will turn their focus to key US economic data, including Durable Goods Orders, the Conference Board’s Consumer Confidence Index, and the Richmond Manufacturing Index, for fresh impetus during the US trading session.

Gold Price Outlook: Support and Resistance Levels

Gold’s recent decline may attract dip-buying near the $2,736 support zone, as the technical setup remains bullish. Any further slide below the $2,750-2,748 range could find solid support near $2,736, with additional key levels at $2,725-2,720. A break below $2,720 could trigger technical selling, pushing prices toward the $2,665-2,662 zone.

On the upside, a sustained move above the $2,772-2,773 resistance could open the door for a retest of the recent peak near $2,786. Further buying momentum beyond the $2,800 psychological level could signal a renewed bullish phase, extending the upward trend

Gold Price Remains Defensive Below Multi-Month High Amid Risk-On Sentiment

Gold price (XAU/USD) came under selling pressure during the Asian session on Thursday, retreating from the multi-month high of $2,763–$2,764 touched the previous day. This decline halts a three-day winning streak. The US Dollar (USD) gained some strength from its recovery off a monthly low, supported by a rebound in US Treasury bond yields, and the upbeat sentiment in equity markets further dampened demand for the safe-haven metal.

Signs of easing inflation in the US have fueled expectations that the Federal Reserve (Fed) might cut interest rates twice this year, creating a potential headwind for US bond yields and the USD. However, ongoing uncertainty surrounding President Donald Trump’s tariff plans, which could increase trade tensions and market volatility, may help limit the downside for gold prices. Traders may remain cautious and wait for sustained selling pressure to confirm that the one-month uptrend has ended.

Risk-On Mood and Modest USD Rebound Cap Gold Gains

The USD steadied above its recent lows amid recovering Treasury yields, adding pressure to gold prices. In addition, easing geopolitical tensions and a lack of concrete details regarding Trump’s tariff policies have maintained a risk-on sentiment, further undermining gold’s appeal.

While Trump’s proposed tariff policies are considered inflationary, which could prompt the Fed to maintain a hawkish stance, markets are still pricing in at least two Fed rate cuts this year. This outlook may limit the upside for US bond yields and the USD, potentially supporting gold in the near term.

Investors are eyeing Trump’s speech at the World Economic Forum for more clarity on tariffs, alongside the release of US Weekly Jobless Claims, which could influence XAU/USD prices. Upcoming central bank rate decisions, including the Bank of Japan’s meeting on Friday and next week’s announcements from the Fed and the European Central Bank, could inject volatility into the market and impact gold prices.

Gold Price Technical Analysis

Key Support Levels:

  • Immediate support is seen near the $2,725–$2,720 zone, a former resistance-turned-support level.
  • Further declines could target the $2,700 mark, with a decisive break paving the way for a move toward the $2,665–$2,662 region.
  • The $2,627–$2,622 confluence, which includes the 100-day EMA and a short-term ascending trendline, will act as a critical pivot point for short-term traders.

Key Resistance Levels:

  • The recent high near $2,763–$2,764 offers the first resistance level.
  • A break above this zone could see gold prices challenge the all-time high around $2,790, reached in October.
  • The $2,800 mark is the next significant resistance, and a break above it would signal a continuation of the well-established uptrend over the past month.

Outlook:

Gold prices remain influenced by risk sentiment, central bank policy expectations, and USD movements. While near-term bearish factors may limit gains, uncertainty around US tariff policies and inflation trends could provide support, making any dips near key technical levels potential opportunities for dip-buying. Traders will remain focused on upcoming economic data and central bank decisions for further direction.

WTI Inches Higher to $70.50 Amid US Oil Stock Decline

WTI Inches Higher to $70.50 Amid US Oil Stock Decline

West Texas Intermediate (WTI) crude oil prices continue to rise for the second consecutive day, trading around $70.40 per barrel during Friday’s Asian session. The upward momentum in oil prices is primarily driven by an unexpected drop in US crude oil inventories.

The Energy Information Administration (EIA) reported that US crude oil stocks fell by 2.192 million barrels for the week ending October 11, defying market expectations of a 2.3 million barrel increase. This contrasts with the previous week’s significant build of 5.81 million barrels, adding bullish sentiment to the oil market.

In addition to the inventory drawdown, rising geopolitical tensions in the Middle East are supporting oil prices. Israel’s military confirmed the death of Yahya Sinwar, the leader of Hamas in Gaza, during an operation in southern Gaza. This development has heightened concerns of escalating conflict in the region, which could disrupt global oil supply chains.

However, the potential upside for WTI prices may be capped by several factors. The EIA also reported that US crude oil production hit a record high of 13.5 million barrels per day last week, adding supply-side pressure. Furthermore, Libya’s oil production has resumed, and OPEC+ plans to gradually unwind production cuts by 2025, according to Reuters.

Additionally, the International Energy Agency (IEA) released a report on Tuesday forecasting a significant oil surplus in 2024. Global oil demand is expected to increase by 860,000 barrels per day next year, but this represents a downward revision of 40,000 barrels per day from earlier forecasts. The IEA attributed this adjustment to slower economic growth in China and the increasing adoption of electric vehicles, which are starting to reshape oil demand in the world’s largest oil importer.

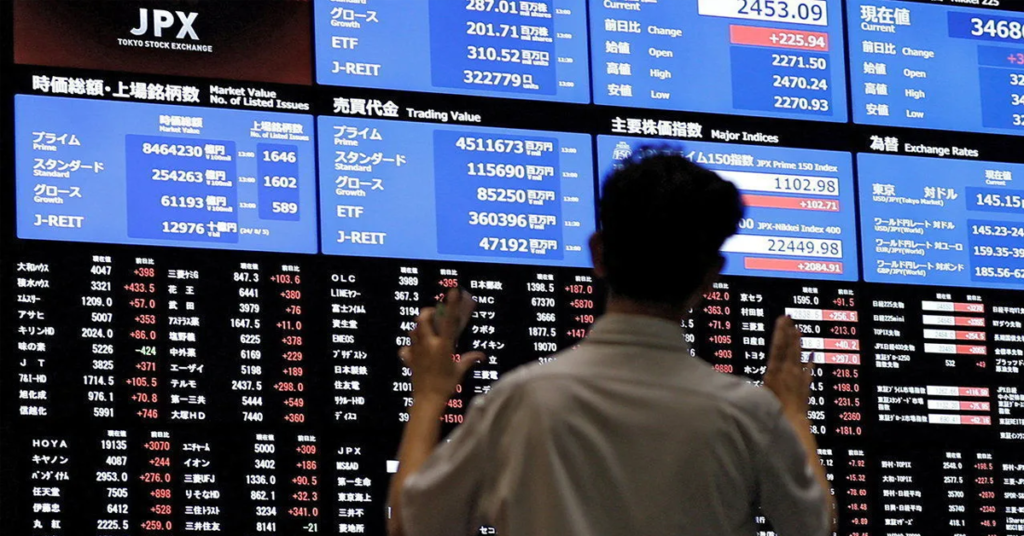
Japan Stocks Climb as Nikkei 225 Gains 2.01% at Close

Japan Stocks Climb as Nikkei 225 Gains 2.01% at Close

Japanese stocks ended higher on Thursday, led by strong performances in the Mining, Chemical, Petroleum & Plastic, and Real Estate sectors. The Nikkei 225 index surged by 2.01%, marking a strong session.

Top performers of the day included M3 Inc. (TYO:2413), which saw an impressive 9.93% rise, adding 145.00 points to close at 1,605.00. Sumitomo Dainippon Pharma Co., Ltd. (TYO:4506) followed with an 8.91% gain, closing at 648.00, and Ajinomoto Co., Inc. (TYO:2802) rose 5.58%, finishing at 5,786.00.

On the downside, Pacific Metals Co., Ltd. (TYO:5541) was the worst performer, dropping 1.73% to close at 1,423.00. Nitori Holdings Co., Ltd. (TYO:9843) declined by 1.59%, ending at 20,715.00, and Japan Exchange Group Inc. (TYO:8697) fell 1.44% to 1,877.00.

Overall, rising stocks outnumbered declining ones on the Tokyo Stock Exchange by 2,540 to 1,052, with 260 shares unchanged.

The Nikkei Volatility Index, which tracks the implied volatility of Nikkei 225 options, dropped by 12.33% to 24.75, signaling lower market uncertainty.

In commodities, crude oil for November delivery climbed 1.53% to $71.17 per barrel, while Brent oil for December delivery increased by 1.35% to $74.90 per barrel. Gold futures for December delivery also rose 0.21%, reaching $2,675.20 per ounce.

In currency markets, USD/JPY rose 0.18% to 146.72, while EUR/JPY edged up 0.03% to 161.83. The US Dollar Index Futures also gained 0.20%, reaching 101.63.

Intel Leads Dow Jones as Top Gainer Amid $5 Billion Apollo Investment Rumors

Intel Leads Dow Jones as Top Gainer Amid $5 Billion Apollo Investment Rumors

Intel (INTC) emerged as the top performer in the Dow Jones Industrial Average (DJIA) on Monday, outperforming major companies like Visa (V), Walmart (WMT), and Boeing (BA). The semiconductor giant’s shares surged by 3.3% on reports that Apollo Global Management is in discussions to invest $5 billion in the company.

Despite the overall modest market performance— the Dow Jones closed up by 0.15%, comparable to the NASDAQ but trailing the S&P 500—Intel’s stock benefitted from this potential infusion of capital.

Intel Stock News

According to a Bloomberg report from Sunday, Apollo, a leading alternative asset manager, has proposed a $5 billion investment in Intel, which Intel’s management is currently considering. This follows news from last Friday that Qualcomm (QCOM) may be exploring the possibility of acquiring Intel, a move that would mark one of the largest mergers in the semiconductor industry.

Intel, despite its value having fallen by over 50% year-to-date, still boasts a market cap of around $90 billion, while Qualcomm’s valuation is just under $200 billion. A combination of the two companies would create the largest semiconductor firm globally. However, Stifel analyst Ruben Roy quickly downplayed the likelihood of such a deal, citing regulatory hurdles that have derailed similar large-scale acquisitions in the past, such as Nvidia’s (NVDA) failed bid to acquire ARM Holdings and Broadcom’s (AVGO) unsuccessful attempt to buy Qualcomm.

Broadcom had also reportedly considered acquiring Intel but, according to insiders, decided not to move forward with a proposal over the weekend.

Raymond James analyst Srini Pajjuri expressed skepticism about Qualcomm receiving regulatory approval for the deal, especially given China’s influence in approving major tech mergers: “The speculated QCOM+Intel deal is unlikely to receive China regulatory approval in our view, given the recent M&A experience in the industry,” Pajjuri noted.

Additionally, Intel has been evaluating the sale of its Altera unit, which produces programmable chips. Analysts estimate that the division alone could be worth $22 billion, while other parts of Intel’s business could fetch valuations up to $140 billion in the capital markets.

Intel Stock Forecast

Intel shares have shown some positive movement, as indicated by the Moving Average Convergence Divergence (MACD) indicator, but the stock has yet to see significant gains. Analysts believe that Intel needs to reclaim the $24.90 support level to attract more bullish interest.

Despite a poor balance sheet, analysts argue that Intel’s parts are worth more than the company as a whole. If acquisition rumors continue to gain momentum, Intel’s stock could rise back toward the $30 range.

Gold Price Holds Steady Near Record High, Awaits Fed Cues for Next Move

Gold Price Holds Steady Near Record High, Awaits Fed Cues for Next Move

Gold price (XAU/USD) continues its sideways consolidation for the second consecutive day on Tuesday, remaining in a narrow range around the $2,500 psychological level as the European session approaches. A generally positive sentiment across global equity markets is acting as a headwind for the safe-haven metal, while a modest recovery in the US Dollar (USD) from its lowest level since January is also capping gains.

Traders seem hesitant to make new bets on Gold’s direction until they receive more clarity on the Federal Reserve’s (Fed) rate-cut trajectory. The focus is now on the release of the July FOMC meeting minutes on Wednesday and Fed Chair Jerome Powell’s speech at the Jackson Hole Symposium on Friday. Meanwhile, dovish expectations for the Fed, combined with ongoing geopolitical risks, could continue to support XAU/USD and limit any downside.

Market Overview: Gold Price Bulls Await Fed Signals

Gold price is extending its consolidative move near record highs, with traders stepping back to await further signals from the Federal Reserve before positioning for the next significant move. The upcoming FOMC minutes and Powell’s speech are expected to offer hints about the possibility of a larger rate cut in September.

Recent strong US Retail Sales data have tempered fears of a recession, leading market participants to scale back expectations for aggressive policy easing. However, the CME Group’s FedWatch Tool still suggests that the Fed may begin its easing cycle in September, with expectations of more than a 200 basis point reduction by the end of 2025.

Key Fed officials, including Minneapolis Fed President Neel Kashkari and Chicago Fed President Austan Goolsbee, have recently commented on the balance of risks and the need for cautious policy adjustments, reflecting ongoing concerns about the US economy.

Geopolitical Updates and Technical Analysis

On the geopolitical front, US Secretary of State Antony Blinken indicated that progress is being made in negotiations to resolve disagreements in the Middle East, which could reduce tensions and boost risk appetite among investors.

From a technical perspective, Gold’s current range-bound movement is likely a bullish consolidation before another leg higher. The constructive outlook is supported by daily chart oscillators that remain in positive territory, though not yet overbought. Bulls are waiting for a breakout above Friday’s all-time high near the $2,509-2,510 area to confirm further gains.

On the downside, immediate support is seen around the $2,472-2,470 resistance-turned-support level. Any decline below this could attract fresh buyers, with key support at $2,448-2,446. A break below this level could lead to a deeper correction, potentially pushing prices towards the 50-day Simple Moving Average (SMA) near $2,392.

Gold Price Awaiting US Macro Data for Potential Gains

Gold Price Awaiting US Macro Data for Potential Gains

Gold prices (XAU/USD) saw a decline on Wednesday as investors adjusted their expectations for the Federal Reserve’s (Fed) policy after the release of US consumer inflation data. However, persistent geopolitical tensions in the Middle East, expectations of the Fed initiating a rate-cutting cycle soon, and a subdued US Dollar (USD) helped gold regain positive momentum on Thursday.

Despite reduced expectations for a 50 basis point (bps) Fed rate cut in September leading to a modest recovery in US Treasury yields, which could limit aggressive bullish positioning on non-yielding gold, the overall market environment still supports the potential for further gains. Additionally, a generally positive tone in equity markets could pose a challenge to the safe-haven metal. Nonetheless, the fundamental backdrop remains favorable for gold ahead of key US macroeconomic data scheduled for release later on Thursday.

Market Movers: Gold Price Supported by Geopolitical Risk and Weak USD Demand

On Wednesday, data showed that US consumer prices increased as expected in July, dampening hopes for a significant rate cut by the Fed in September. The US Bureau of Labor Statistics (BLS) reported a moderate 0.2% rise in headline CPI for July, following a 0.1% decline the previous month. The annual CPI increase fell below 3% for the first time in nearly three and a half years, indicating ongoing progress toward the Fed’s inflation targets.

Core CPI, excluding volatile food and energy prices, also increased by 0.2% in July, easing to 3.2% year-on-year from 3.3% in June. As a result, the CME Group’s FedWatch Tool now shows a 36% probability of a 50 bps rate cut at the next Federal Open Market Committee (FOMC) meeting, down from 50% before the CPI data. This led to a late recovery in US Treasury yields, which attracted some buying interest in the USD and weighed on gold.

Despite this, ongoing geopolitical tensions provide some support for gold. Mediators are aiming to initiate ceasefire talks between Israel and Hamas amid the potential threat of an imminent Iranian attack on Israel.

Traders are now focusing on upcoming US economic reports, including Retail Sales, Weekly Initial Jobless Claims, and regional manufacturing indices, for short-term trading opportunities.

Technical Outlook: Gold Price Poised for Further Gains Above $2,470 Resistance

Technically, the recent swing low around the $2,438 level is acting as immediate support, followed by the $2,424 area, which was the weekly low on Monday. Continued selling pressure could push gold below the $2,400 mark, targeting the 50-day Simple Moving Average (SMA) near the $2,380 zone. A decisive break below this level could expose the 100-day SMA near the $2,360 region, potentially triggering further bearish momentum.

However, daily chart oscillators remain in positive territory, indicating potential for additional near-term gains. Any further upward movement is likely to encounter resistance around the $2,471-$2,472 region, followed by the $2,483-$2,484 area, which marks the all-time high reached in July. A sustained rise beyond the $2,500 psychological mark would confirm a breakout from the one-month-old trading range and set the stage for further appreciation.

Asian Shares Rise, Kiwi Slumps as New Zealand Cuts Rates

Asian Shares Rise, Kiwi Slumps as New Zealand Cuts Rates

Asian shares climbed on Wednesday following softer-than-expected U.S. producer price data, which bolstered hopes for mild consumer price inflation. Meanwhile, the New Zealand dollar (kiwi) tumbled after the Reserve Bank of New Zealand (RBNZ) cut interest rates for the first time since early 2020.

European stock futures pointed to a higher opening, with data showing that British inflation in July rose less than anticipated. EUROSTOXX 50 futures gained 0.5%, and FTSE futures rose 0.6%. U.S. equity futures remained flat.

In Japan, the announcement that Prime Minister Fumio Kishida would step down as ruling party leader in September added to the busy news flow in Asia. His tenure has been marked by rising prices and political scandals. Following the news, the Japanese yen dipped 0.2%, while the Nikkei index rose 0.6%, recovering from last week’s sharp selloff.

The New Zealand dollar slumped by 1.1% after the RBNZ cut interest rates by 25 basis points to 5.25% and signaled further easing. This move was earlier than the bank’s own projections. Sharon Zollner, chief economist at ANZ, commented, “The RBNZ faced a tricky decision today – turning points are always difficult. But the Committee decided they had sufficient confidence in the inflation outlook to start easing monetary conditions.” ANZ has now penciled in a series of 25 basis point cuts, potentially bringing rates down to 3.5%.

MSCI’s broadest index of Asia-Pacific shares outside Japan rose 0.4%, with most markets up except China, where both Hong Kong’s Hang Seng and mainland blue chips fell 0.5%.

Wall Street saw a strong rebound after U.S. producer price data indicated a slower rise than expected in July, suggesting continued moderation in inflation. This prompted markets to slightly increase the odds of a 50 basis point rate cut by the Federal Reserve in September, from 50% to 53%, according to the CME FedWatch Tool.

Goldman Sachs adjusted its forecast for the core Personal Consumption Expenditures (PCE) price index, the Fed’s preferred inflation measure, to a 0.14% rise in July, down from the previous estimate of 0.17%. Investors are now keenly awaiting consumer price data for July, with economists expecting 0.2% increases in both the headline and core figures, and a slight slowdown in the annual core inflation rate to 3.2%.

Chris Weston, head of research at Pepperstone, noted, “Risk will find buyers if additional implied rate cuts are driven by a reduced inflation dynamic. However, the opposite is true if any additional rate cuts are driven by weaker growth or poor labor market readings – this week’s U.S. retail sales report could therefore be influential on that thesis.”

U.S. bonds experienced solid buying overnight, with two-year yields falling to 3.9392% and ten-year Treasury yields holding at 3.8465% after a 5 basis point drop.

The U.S. dollar was slightly lower due to falling bond yields, edging up 0.1% to 102.70 against major peers after losing 0.5% overnight. The euro strengthened 0.6% overnight, trading near $1.0988, close to a significant resistance level of $1.1.

In commodities, crude oil prices recovered some of the previous day’s losses, with Brent crude futures rising 0.7% to $81.23 a barrel and U.S. West Texas Intermediate crude up 0.7% to $78.93. Gold prices increased by 0.1%, reaching $2,461.72 an ounce.


Crude Oil Climbed Whether Russia’s Oil Imports Will Be Banned by the EU

Crude Oil Climbed Whether Russia’s Oil Imports Will Be Banned by the EU

Crude oil closed yesterday at 9080, up 2.06%, as traders awaited news on whether the European Union would agree to an embargo on Russian oil imports. On Monday and Tuesday, the EU will gather to consider the sixth package of sanctions against Russia for its invasion of Ukraine, which Moscow refers to as a “special military operation.”

When the Organization of Petroleum Exporting Countries and its allies, including Russia, meet on Thursday, they are expected to reject Western efforts to accelerate output increases, underscoring market tightness. They will maintain to their existing plans to increase output by 432,000 barrels per day in July. Russia slightly increased oil production to 10.17 million barrels per day (bpd) between May 1 and 29, according to the TASS news agency, although output is still over 1 million bpd lower than when the West placed sanctions on Moscow. After some clients postponed or denied Russian barrels owing to sanctions, production from the world’s third-largest producer after the United States and Saudi Arabia fell by almost 10% to 10.05 million bpd in April from February. On May 1-29, TASS reported that output had been marginally restored to 10.17 million bpd.

Technically, the market is seeing fresh buying, with open interest up 9.13 percent to settle at 11055, while prices are up 183 rupees. Crude oil is now getting support at 8987, with a move below seeing prices test 8894 levels, and resistance is now likely to be seen at 9131, with a move above seeing prices test 9182 levels.

Dollar falls, Gold prices rise in range-bound trade

Dollar falls, Gold prices rise in range-bound trade

Gold prices rose in turbulent trading on Monday, bolstered by a weaker dollar, which boosted greenback-priced metal, though gains were limited as some investors shifted to riskier Asian assets. As of 0152 GMT, spot gold was up 0.2 percent at $1,856.86 per ounce. Gold futures in the United States rose 0.1 percent to $1,859.40.

“We may find that gold will remain nailed to its tight range around $1,850 unless a new catalyst arrives,” City Index senior market analyst Matt Simpson said. “With the 3-day holiday in the US, which means lower liquidity than usual, and a lack of top-tier data until Wednesday, we may find that gold will remain nailed to its tight range around $1,850 unless a new catalyst arrives.”

For the Memorial Day holiday in the United States, federal government offices, stock and bond markets, and the Federal Reserve will be closed on Monday. Despite a mainly positive performance since hitting a more than three-month low of $1,786.60 per ounce on May 16, gold prices are on track for their first monthly drop since March 2021, down roughly 2.4 percent so far.

“Gold’s underperformance has been attributed in part to investors rushing to cash as equities markets dropped, as well as Chinese lockdowns. June is traditionally a bad month for gold, but that trend looks to have been shifted forward by one month “Simpson said. Investors bet on a pause in US monetary tightening, despite big hikes in June and July, as Asian equities followed Wall Street higher and the dollar remained at five-week lows.

For buyers holding other currencies, a weakened dollar makes bullion more appealing. The potential cost of storing non-yielding bullion rises when short-term interest rates in the United States rise. Spot silver increased by 0.1 percent to $22.13 per ounce, platinum increased by 0.1 percent to $954.51, and palladium increased by 0.8 percent to $2,079.39 per ounce.

Gold prices are declining as the Fed maintains its aggressive policy stance

Gold prices are declining as the Fed maintains its aggressive policy stance

On Thursday, gold prices fell, with some investors profiting after minutes from a US Federal Reserve policy meeting revealed that the central bank was likely to maintain its interest-rate hikes. The price of spot gold fell 0.1 percent to $1,851.57 per ounce. Gold futures in the United States rose 0.2 percent to $1,849.8. According to Brian Lan, managing director of dealer Gold Silver Central, the Fed’s resolve to hiking rates has influenced gold a little, with some profits being taken as the news sinks in, and prices could drop to $1,820 or so.

On Wednesday, gold recovered some of its losses caused by the dollar’s rise as minutes from the Fed’s May meeting suggested the central bank would not become more aggressive, instead raising interest rates by 50 basis points in June and July to combat inflation. In the long run, however, investors who are aware that a recession is on the horizon are looking for a high-value asset that can help them get through this period, and gold will shine, according to Lan.

The opportunity cost of owning bullion, which returns nothing, rises as short-term interest rates and bond yields rise in the United States. During financial crises, however, gold is seen as a safe-haven asset. The Fed’s decision to add two more half-percentage-point raises and then wait to see how they affect the economy was good for gold, but the market’s reaction has been disappointing, according to Michael McCarthy, chief strategy officer at Tiger Brokers in Australia.

The world’s largest gold-backed exchange-traded fund, SPDR Gold Trust, reported a 0.2 percent increase in holdings to 1,069.81 tones on Wednesday, up from 1,068.07 tones the day before. Spot silver rose 0.1 percent to $21.99 per ounce, while platinum rose 0.2 percent and palladium rose 0.5 percent to $2,015.72 per ounce.

Global oil prices have risen again as EU negotiates with Hungary

Global oil prices have risen again as EU negotiates with Hungary

Oil prices increased on Thursday, extending a cautious advance this week on signals of constrained supply, as the European Union (EU) negotiates with Hungary over plans to prohibit imports from Russia, the world’s second-largest crude supplier, following its invasion of Ukraine. At 0142 GMT, Brent crude futures for July settlement were up 7 cents, or 0.1 percent, to $114.10 per barrel. WTI crude futures for July delivery in the United States rose 22 cents, or 0.2 percent, to $110.55 a barrel.

“An EU embargo on Russian oil imports is the key upward driver,” Commonwealth Bank commodities analyst. On Wednesday, European Council President Charles Michel expressed confidence that a deal may be struck before the council’s next meeting on May 30. However, Hungary continues to be a stumbling barrier to the EU penalties that require unanimous agreement. Hungary is requesting 750 million Euros ($800 million) to improve its refineries and expand a pipeline from Croatia, allowing it to transition away from Russian oil.

Even without a formal ban, Russian oil is scarce on the market as buyers and traders avoid interacting with the country’s crude and fuel providers. Cargoes from Baltic ports are taking lengthier routes to Asian refineries, according to ANZ analysts, while exports to the Netherlands and France have all but ceased. The Permian Basin’s expected growth in oil output to a record high of 5.2 million barrels per day (bpd) is unlikely to close the 2 million to 3 million bpd gap left by lost Russian supply analyst said. Nonetheless, rigorous COVID-19 lockdowns have curbed this week’s increase in oil markets, raising concerns about falling gasoline demand in China, the world’s largest oil importer, and concerns about inflation slowing global economy.

On the back of the Fed Minutes, sellers of XAU/USD are targeting $1,848

On the back of the Fed Minutes, sellers of XAU/USD are targeting $1,848

During Wednesday’s Asian session, the gold price (XAU/USD) posts its first daily loss in five days, dropping to an intraday low of roughly $1,860. The recent weakness of the metal could be linked to the US dollar’s recovery from a monthly low ahead of crucial data and events. However, the US Dollar Index (DXY) is up 0.21 percent after recovering from a four-week low to reclaim the 102.00 level. The market’s preparations for the US Durable Goods Orders for April, projected at 0.6 percent versus 1.1 percent previously, as well as the Federal Open Market Committee (FOMC) Minutes, could be linked to the risk-negative reports from China and South Korea.

The shooting of three missiles by North Korea, as well as Japan’s displeasure with it, have added to the market’s nervousness ahead of today’s Fed Minutes, and appear to be weighing on the market’s optimism. The news regarding China’s COVID lockdowns and their detrimental effects on the world’s second-largest economy could be on the same line. “Beijing has kept its COVID quarantine in place for another month, while Shanghai authorities aim to keep most restrictions in place this month before releasing the two-month-old lockdown completely on June 1,” Bloomberg said.

While the S&P 500 Futures pare early-day gains at 3,955, up 0.40 percent intraday, the US 10-year Treasury yields remain protective around a one-month low, at 2.76 percent at press time. In contrast to the ECB’s hawkish statements, disappointing US housing statistics and repeated Fedspeak put downward pressure on US Treasury rates and the US Dollar on Tuesday. Gold prices are likely to face the brunt of the US dollar’s recovery in the future. However, any more bearish FOMC Minutes and/or negative US data will allow the precious metal to recover some of its recent losses.

Gold prices fall as the dollar tries to recover

Gold prices fall as the dollar tries to recover

Gold prices fell marginally on Tuesday as the dollar recovered slightly after a recent dip, impacting on demand for greenback-priced gold. After reaching to its highest level since May 9 of $1,865.29 on Monday, spot gold dipped 0.2 percent to $1,850.40 per ounce at 0240 GMT. Gold futures in the United States were unchanged at $1,848.20. The safe-haven dollar recovered some of its losses from the previous day. Bullion becomes more expensive for foreign customers when the currency strengthens.

Bullion, which is seen as a safe haven during economic downturns, loses its appeal to investors when interest rates in the United States rise since it pays no interest. “Gold remains oversold in my opinion, and the daily closing (on Monday) above the 200-day average is bullish,” Simpson said. The world’s largest gold-backed exchange-traded fund, SPDR Gold Trust, reported a 0.44 percent increase in holdings to 1,068.07 tonnes on Monday, up from 1,063.43 tonnes on Friday.

The yield on the benchmark 10-year Treasury note fell, reducing losses in zero-yield gold. Silver fell 0.3 percent to $21.71 per ounce, platinum fell 1.3 percent to $946.00, while palladium rose 0.1 percent to $1,994.50 per ounce. Due to weaker demand from the automotive industry throughout the Ukraine crisis and a gradual recovery of the chip business from a shortfall, Russia’s Nornickel cut its projection for the global palladium market deficit in 2022.

Oil rises as traders consider a tight fuel market and poor global growth

Oil rises as traders consider a tight fuel market and poor global growth

Investors evaluated tight product markets against concerns about slowing global growth as oil prices increased at the start of the week. Following four weeks of advances, West Texas Intermediate rose beyond $111 a barrel, the longest such run since February. Prices of gasoline and diesel have risen to new highs ahead of the start of the US driving season, which starts in a week. Bullish oil bets have also been boosted by money managers.

Oil prices have risen this year as a result of increased demand and the worldwide consequences from Russia’s invasion. Energy price increases have led to high inflation, leading central banks to hike interest rates and raising market concerns that GDP could slow. At the same time, to combat Covid-19 outbreaks, China has implemented a series of crippling lockdowns, harming Asia’s greatest economy.

Oil markets are still in backwardation, which is a positive pattern in which short-term prices trade above longer-term ones. Brent’s prompt spread was $2.58 a barrel in backwardation, up from $2.13 a barrel a week ago. A weakening dollar may have given crude an extra boost, making the commodity cheaper for holders of foreign currencies. The dollar fell on Monday after falling 1.4 percent last week, the most since November 2020.

According to Bloomberg Intelligence, oil may have a ceiling of around $110 per barrel due to China’s falling demand and economic growth being hampered by Beijing’s efforts to eradicate Covid-19. Bloomberg Economics has lowered its China growth projection for the year to 2% from 5.7 percent.

The image in Asia’s largest economy is still bleak. Officials in Shanghai have laid out the criteria for classifying portions of the commercial centre as low-risk for Covid-19 as they prepare to terminate two-month quarantine, with no new cases detected outside of confinement. However, Beijing recorded a record number of cases, reviving fears that the capital may be shut down.

EUR/USD Price Forecast: Consolidating Below 1.0500 Amid Multi-Week High

The EUR/USD currency pair is having a hard time continuing its recent winning streak, trading in a tight range just below the 1.0500 psychological mark during the Asian session on Monday. In spite of the consolidation, the pair is still close to its three-week high of Friday, buoyed by a weaker US Dollar (USD).

Technically, the pairs location above the 38.2% Fibonacci retracement level of the November-January bear run, combined with upbeat oscillators on the daily chart, indicates that the bullish momentum is still intact. This leaves room for a potential rally towards the 1.0545-1.0555 resistance area, which coincides with the 50% Fibonacci retracement level and the 100-day Exponential Moving Average (EMA).

A successful breach above this crucial barrier may set the stage for additional gains, with EUR/USD potentially challenging the 1.0600 level. A break above this level may propel the pair towards the December 2024 swing high of 1.0630, close to the 61.8% Fibonacci retracement level. Further bullish momentum may continue to drive the rebound from its more than two-year low in January.

To the contrary, however, the 38.2% Fibonacci level of 1.0465 acts as an instant support level. A resolute breach through this area can drive selling momentum faster, pulling the pair towards the 1.0400 round number and down further into the mid-1.0300s (23.6% Fibonacci level). Failure to hold these levels could shift the bias in favor of bearish traders, potentially exposing the 1.0200 handle.

EUR/USD Eases Near 1.0300 Ahead of Lagarde’s Speech

The EUR/USD pair edges lower to approximately 1.0310 during the Asian session on Monday, weighed down by a stronger US Dollar (USD). Market participants are focused on the upcoming Eurozone Sentix Investor Confidence data for February and a speech by European Central Bank (ECB) President Christine Lagarde later in the day.

On Friday, former US President Donald Trump announced plans to introduce reciprocal tariffs on multiple countries by Tuesday or Wednesday, though he did not specify which ones. This move has heightened concerns about a global trade war, fueling demand for the safe-haven USD.

“The immediate concern might not be inflation, as counter-effects like a demand slowdown could come into play. However, the bigger issue is uncertainty and the shift toward a more protectionist world,” said Charu Chanana, Chief Investment Strategist at Saxo.

Meanwhile, the Euro faces pressure from growing expectations of further ECB rate cuts amid sluggish economic growth. ECB Governing Council member Boris Vujcic stated that the market’s anticipation of three rate cuts this year is reasonable. However, he emphasized that greater clarity on monetary policy direction may not emerge until early in the second quarter.

Traders will keep a close eye on US trade policies, especially Trump’s repeated threats against Europe. JPMorgan economist Nora Szentivanyi noted that the objectives, timing, and tariff rates remain unclear. Nonetheless, the European Commission has stated it would retaliate firmly against any tariffs imposed by the US.

EUR/USD Struggles Below 1.0400 Ahead of Eurozone Retail Sales Data

EUR/USD is trading lower around 1.0390 in the Asian session on Thursday, extending losses following a two-day recovery. Investors remain wary ahead of the release of Eurozone Retail Sales data later today.

Market predictions suggest that Eurozone retail sales scaled by 1.9% year on year in December, up from the previous 1.2% increase. However, the monthly number is expected to fall by 0.1%, erasing the 0.1% increase reported in November.

The euro remains under pressure as market sentiment points to further monetary easing by the European Central Bank (ECB). Policymakers feel optimistic that inflation will steadily return to the ECB’s 2% objective, lessening the need for additional tightening.

Meanwhile, the US Dollar Index (DXY), which tracks the dollar against six major currencies, has stabilized at 107.70, restricting EUR/USD’s upside potential. The dollar’s resiliency comes after a three-day losing skid, which puts pressure on the pair.

On Thursday, Federal Reserve Vice Chair Philip Jefferson reiterated his desire for keeping existing interest rates, underlining that the Fed’s policy remained restrictive despite the 100-basis-point drop. Meanwhile, San Francisco Federal Reserve President Mary Daly emphasized the central bank’s cautious attitude in the face of prolonged economic uncertainties.

The dollar weakened on Wednesday following a disappointing US Services PMI reading. The ISM Services PMI dropped to 52.8 in January from a revised 54.0 in December, falling short of the market consensus of 54.3. Looking ahead, traders are watching Friday’s US Nonfarm Payrolls (NFP) report, which might influence the Federal Reserve’s next policy actions.

EUR/USD Struggles for Clear Direction, Stays Range-Bound Near 1.0375-1.0380

The EUR/USD pair continues in consolidation mode, failing to build on its recent recovery from the 1.0200 region—the lowest level since January 13. After reaching a weekly high earlier on Wednesday, the pair is fluctuating within a narrow range around 1.0375-1.0380, showing little change for the day amid mixed market signals.

Tuesday’s Job Openings and Labor Turnover Survey (JOLTS) indicated a cooling U.S. labor market, reinforcing expectations of Federal Reserve (Fed) policy easing. Markets are now factoring in the likelihood of two rate cuts by the Fed this year. Risk-on sentiment also remains prevalent, but should continue to weigh on demand for the safe-haven USD, and thereby support EUR/USD.

Upside momentum, however remains constrained by issues on the introduction of U.S. tariffs over the goods to be imported in Europe under Trump’s administration, among others, and the ECB dovish direction which is being felt in restraining the Euro though HICP was reported higher to an annual rate of 2.5% in the last month, still, does not allow much upside in this pair.

Looking ahead, market participants will focus on the final Eurozone Services PMI release, while the U.S. economic calendar highlights the ADP private-sector employment report and the ISM Services PMI. Movements in the USD could also be influenced by key FOMC member speeches. Still, Friday’s NFP report will focus more attention on it as it will help deliver a better picture of the situation in the U.S. labor market and set the direction for future Fed policy.

GBP/USD Holds Above 1.2400 as Markets Watch China Tariff Developments

GBP/USD extends its gains for a second consecutive session, trading around 1.2430 during Asian market hours on Tuesday. With  the  decision   by   U.S. President Donald Trump   to pause tariffs on Mexico and Canada , the pair benefits from a risk-on sentiment .

Despite this, investors continue to pay close attention to ongoing trade negotiations, making market volatility a major concern. Trump declared that he would postpone imposing high tariffs on Canada and Mexico for at least 30 days following their agreements to send 10,000 troops to the U.S. border to fight drug trafficking.

This move follows Trump’s recent decision to impose 25% tariffs on Mexican and Canadian goods, along with a 10% tariff on Chinese imports. Additional tariffs on China are anticipated to go into effect Tuesday at 5:00 GMT. Trump managed to say that talks with Chinese officials might happen “probably over the next 24 hours,” and that tariffs on China would be “very, very substantial” if an agreement could not be made.

Meanwhile, the U.S. Dollar Index (DXY), which tracks the USD against six major currencies, hovers around 108.70 after erasing most of its gains from the previous session. Strong U.S. economic data could provide support for the greenback, as the ISM Manufacturing PMI climbed to 50.9 in January from 49.3 in December, surpassing the expected 49.8.

While GBP/USD may rise, the British Pound’s upside may be limited, given the expectation that the Bank of England (BoE) will cut interest rates once again. Despite rising wages in the UK, the BoE is expected to lower interest rates by 25 basis points to 4.5% on Thursday.

The BoE’s Monetary Policy Committee (MPC) is expected to vote 8-1 in favor of the rate cut, with one member likely advocating for maintaining rates at their current level for now.

EUR/USD Slumps to Multi-Week Low Near 1.0200 Amid Trump’s Trade Tariffs

The EUR/USD pair extends its decline on Monday, plunging to the 1.0200 region—a three-week low—during the early Asian session. This drop brings the pair closer to its lowest level in over two years, last seen in January, reinforcing the ongoing multi-month downtrend.

The US Dollar (USD) gains broad strength following President Donald Trump’s weekend announcement of new tariffs: 25% duties on imports from Canada and Mexico, along with an additional 10% tariff on Chinese goods. These measures escalate global trade tensions, dampening investor appetite for riskier assets and boosting demand for the safe-haven USD. As a result, the EUR/USD pair faces renewed selling pressure.

Adding to the bearish sentiment, Trump also declared on Friday evening that he would impose tariffs on goods from the European Union. This, coupled with the European Central Bank’s (ECB) dovish stance, further weighs on the euro. Last Thursday, the ECB cut borrowing costs by 25 basis points (bps) as expected and signaled the possibility of additional rate cuts before the year’s end, exacerbating the euro’s weakness.

The policy divergence between the ECB and the Federal Reserve (Fed) further tilts market sentiment in favor of the USD. While the Fed has opted for a hawkish pause, supporting the dollar’s strength, a recent pullback in US Treasury yields may limit further USD gains and offer some relief to the EUR/USD pair. However, the overall market outlook suggests that the pair’s downside momentum is likely to persist.

EUR/USD Holds Above 1.0400 Ahead of Q4 GDP Data and ECB Policy Decision

The EUR/USD pair is edging higher after three consecutive losses, trading near 1.0420 during Thursday’s Asian session. The rebound is primarily driven by a technical pullback in the US Dollar (USD). Meanwhile, the US Dollar Index (DXY), which tracks the greenback against six major currencies, remains just below 108.00.

Despite the recent uptick, further gains for EUR/USD may be capped as the USD could regain strength following the Federal Reserve’s (Fed) cautious approach to monetary policy. The Fed reinforced its hawkish stance by removing language suggesting confidence in inflation reaching its 2% target.

During his press conference, Fed Chair Jerome Powell emphasized that any policy changes would require “real progress on inflation or some weakness in the labor market.” As expected, the Fed maintained its overnight borrowing rate at 4.25%-4.50% during its January meeting on Wednesday. This decision follows three consecutive rate cuts since September 2024, totaling a one-percentage-point reduction.

Meanwhile, the Euro faces downward pressure as the European Central Bank (ECB) is widely expected to cut interest rates by 25 basis points in its policy meeting on Thursday, lowering the Deposit Rate to 2.75%. Market sentiment suggests that further rate cuts from the ECB may follow in the coming months, potentially weighing on the Euro.

Investors will closely watch the release of fourth-quarter Gross Domestic Product (GDP) data from the Eurozone and Germany on Thursday. Later in the day, focus will shift to the US Annualized GDP report, which could influence market sentiment and currency movements.

UAE and China Renew $4.9 Billion Currency Swap Agreement

UAE and China Renew $4.9 Billion Currency Swap Agreement

The United Arab Emirates (UAE) and the People’s Republic of China have reinforced their financial ties by renewing a substantial currency swap arrangement. On Tuesday, the Central Bank of the UAE and the People’s Bank of China ratified a continuation of their bilateral currency swap agreement. This deal, valued at 18 billion Emirati Dirhams (approximately $4.9 billion), is set to last for another five years, as confirmed by the UAE’s financial regulator through an official statement. This extension is more than a financial protocol; it represents a strategic effort to deepen the financial and trade relations between the two nations.

In a move signaling commitment to future-oriented financial technology, both nations have also consented to collaborate on the evolution of digital currencies. This is cemented by a newly signed memorandum of understanding (MoU) aimed at fostering cooperation in the burgeoning domain of central bank digital currencies (CBDCs). Under the terms of this MoU, the UAE and China will exchange knowledge on best practices and regulatory frameworks pertinent to digital currencies, and will jointly support the advancement of shared initiatives and projects in this field.

A hallmark of this collaborative venture is the “mBridge” project. This initiative is a pioneering platform involving multiple central banks and is designed to expedite cross-border trade payments, enabling them to occur with near-instantaneous processing times. Such technological advancements are indicative of the shifting paradigm in global financial transactions, reflecting an increasing reliance on digital solutions to streamline and secure cross-border commerce.

The economic relationship between the UAE and China is robust, with the UAE being China’s premier trading partner within the Gulf Cooperation Council (GCC) as of 2021. Notably, the value of non-oil trade transactions between these nations reached an impressive AED264.2 billion in 2022, marking a significant growth of 18% from the previous year. This flourishing trade relationship is a testament to the deep economic integration and mutual reliance that characterize the bond between the two countries.

China’s investment footprint in the UAE is equally noteworthy. As of the beginning of 2021, China was recognized as the third-largest foreign investor in the UAE, boasting investments upwards of $9.3 billion. This figure represents an extraordinary increase of more than 500% from the levels recorded in 2013, as reported by the UAE’s Ministry of Economy. This surge in investment underscores the confidence and strategic interest China places in the UAE’s economic landscape, further solidifying the long-term economic partnership between the two nations.

Yuan’s Rally Strengthens with the Support of Seasonal Trends

Yuan’s Rally Strengthens with the Support of Seasonal Trends

The Chinese yuan is experiencing a notable upswing, propelled by seasonal forces and market speculation that anticipates a continuous rally. Historical data reveals a pattern of the yuan gaining strength in the final months of the year, a trend particularly pronounced in 2022 as reported by financial analysis. This seasonal rise is attributed to the increased need for local currency by exporters, preparing for the year-end financial settlements and the upcoming Lunar New Year celebrations, as observed by China International Capital Corp.

Throughout this year, the yuan has struggled compared to other Asian currencies, prompting corporations to delay converting their dollar reserves in hopes of more advantageous exchange rates. However, with the yuan on course for its most robust month in twelve months amidst a waning US dollar, the tide may be shifting. Companies are likely to adjust their strategies, potentially initiating a more robust and enduring recovery for the yuan.

The sustainability of the yuan’s rally is closely tied to the performance of the US dollar. Analysts, including Evercore ISI’s Neo Wang, recognize December as a critical period where historical patterns suggest a strong yuan performance against the dollar.

Market sentiment is also buoyed by the belief that the yuan’s prolonged decline has reached a turning point, with forecasts suggesting that it may approach the 7-per-dollar mark, a rate last witnessed in May.

The shift in sentiment regarding Chinese financial assets is notable, as economic policymakers in China intensify efforts to revitalize the struggling property sector and as geopolitical tensions ease. The People’s Bank of China has continued to set a supportive reference rate for the yuan, which has recently outperformed this benchmark for the first time since mid-2022. The onshore yuan’s closure at an appreciating rate further signals confidence in the currency’s trajectory.

Looking ahead, analysts maintain an optimistic view for the yuan’s performance as the year draws to a close and looking into 2024. Factors contributing to this positive outlook include a stabilizing macroeconomic environment and favorable seasonal patterns that typically benefit the yuan towards the end of one year and the start of the next. This sentiment reflects a broader confidence in the resilience and potential upturn of the yuan in the global currency markets.

Japanese Yen Gains on Soft Dollar, Fed Dovishness, and Bullish BoJ Outlook

Japanese Yen Gains on Soft Dollar, Fed Dovishness, and Bullish BoJ Outlook

The Japanese Yen (JPY) has recently retreated from its strong gains against the US Dollar (USD), marking a second day of weakening on Wednesday. This shift comes after the US Federal Open Market Committee’s (FOMC) hawkish minutes and better-than-expected labor and consumer sentiment data provided a boost to the USD, lifting it from its lowest levels since the end of August. Consequently, the USD/JPY pair made a notable recovery from the 147.15 area, which was a two-month low reached on Tuesday.

Despite this, spot prices struggled to maintain their upward trajectory past the 149.75 level, facing resistance on Thursday. Market sentiment is tilting toward the belief that the Federal Reserve (Fed) may have concluded its policy-tightening phase and could begin reducing interest rates by May 2024. This anticipation has led to a decline in US Treasury yields, resulting in the selling off of the USD. Furthermore, the possibility of a hawkish pivot in the Bank of Japan’s (BoJ) policy has exerted downward pressure on the USD/JPY, keeping it subdued near the 149.00 level as the European trading session approaches.

In the recent market movements, the Japanese Yen did see a dip to 149.75 against the Dollar on Wednesday but managed to recoup some of its losses by Thursday. Market speculation is rife that the BoJ may terminate its negative interest rate policy in early 2024, contributing to the USD/JPY’s dip on Thursday. Despite this, minutes from the Fed’s last meeting hint at a continued restrictive stance on interest rates.

Economic data from the US painted a mixed picture: Initial Jobless Claims fell significantly to 209,000 for the week ending November 18, indicating a robust labor market. However, the Consumer Sentiment Index continued to decline, reaching 61.3 in November, and inflation expectations rose to 4.5%, marking the highest since April 2023. Durable Goods Orders also fell by 5.4% in October, signaling economic headwinds.

Market participants are now discounting the likelihood of further Fed rate hikes, with many anticipating a rate cut by mid-2024. Traders, adjusting their positions ahead of the US Thanksgiving holiday, are now turning their attention to forthcoming PMI data from the Eurozone and the UK, which could affect global risk sentiment and the demand for the safe-haven Yen. The upcoming release of Japan’s National core CPI, followed by US PMIs, will also be closely monitored for their potential impact on currency markets.

ECB Highlights Potential Stability Risks from Bank Taxation Impacting Valuations

ECB Highlights Potential Stability Risks from Bank Taxation Impacting Valuations

The European Central Bank (ECB) recently expressed concerns about the potential risks to financial stability arising from special taxes imposed on banks. According to an ECB report released on Monday, these taxes could lead to tighter financing conditions across the region, exacerbated by the low stock market valuations of these financial institutions.

Despite European banks reporting their highest earnings in several years, their stock values have not seen a significant increase from the pre-COVID-19 pandemic levels. The ECB attributes this discrepancy partly to the proposed special bank taxes in various countries, sparking worries about the implications for shareholder dividends.

The ECB’s report emphasizes the long-term risks associated with these developments. Banks that are undervalued by investors could face difficulties in raising new equity when necessary. This scenario is particularly concerning as the capital needed to support lending is funded by lending rates. Therefore, weaker valuations of banks could lead to stricter financing terms and conditions, directly affecting the broader economy.

Special bank taxes have become a favored approach by governments to address budget deficits, particularly in the context of rising borrowing costs. Many policymakers justify these taxes by pointing out that banks have disproportionately benefited from the rapid increase in interest rates, yet have been slow in passing these benefits on to consumers.

Over the past two years, various proposals for special banking taxes have been introduced, with the aim of generating over €6 billion for government coffers next year, as per Bloomberg News. Nonetheless, the actual revenue generated may be lower than anticipated due to exemptions and loopholes. For instance, in Italy, certain provisions allow banks to circumvent these taxes.

This situation poses a complex challenge for policymakers and regulators. On one hand, there is a need to manage public finances effectively, especially in a period marked by economic uncertainty and rising costs. On the other hand, ensuring the stability and health of the banking sector is crucial for the overall economy. The ECB’s warning underlines the delicate balance that must be struck between these objectives.

The report by the ECB serves as a cautionary note, highlighting the intricate link between fiscal policies, bank valuations, and economic stability. It calls for careful consideration of the implications of such tax measures on the banking sector and, by extension, on the financing conditions within the European economy. As governments navigate these challenges, the focus remains on finding a sustainable solution that supports public finances without compromising the stability and efficiency of the banking system.

Pimco Invests in Yen Anticipating Stricter BOJ Policies

Pimco Invests in Yen Anticipating Stricter BOJ Policies

Pacific Investment Management Co. (Pimco) is strategically purchasing Japanese yen, speculating that Japan’s central bank may soon implement tighter monetary policies due to rising inflation. The investment firm took a bullish stance on the yen, building up a long position as the currency’s value dipped beyond 140 to the US dollar. This move aligns with Pimco’s anticipation of a potential policy shift by the Bank of Japan (BOJ), including a move away from its yield-curve control policies and possibly leading to an interest rate hike.

Despite a general expectation of a yen rally due to contrasting policies of a hawkish Federal Reserve and a dovish BOJ, the yen has depreciated over 12% against the dollar this year, nearing a three-decade low. This decline occurred even as the BOJ has shown signs of easing its tight control over the yield curve.

The BOJ’s incremental steps towards a more constricted monetary stance have not yet resulted in a durable appreciation of the yen. In fact, leveraged funds have increased their short positions on the currency, indicating a widespread prediction of further depreciation.

Emmanuel Sharef of Pimco believes there is a clear need for the BOJ to continue tightening its monetary policy, possibly through more subtle methods initially, such as gradually phasing out its yield-curve control, with a potential rate hike on the horizon.

Former Federal Reserve Vice Chair Richard Clarida, now with Pimco, has speculated that the BOJ may abandon its yield-curve control by the end of the year if inflation persists and could adjust its short-term interest rate to zero from the current negative rate early next year.

Japan’s inflation cooled slightly to below 3% in September, offering some validation to the BOJ’s assessment that inflationary pressures are reaching their peak. However, the rate still exceeded the consensus forecast.

In the backdrop of market dynamics, Sharef also manages strategies at Pimco, such as the Inflation Response Multi-Asset Fund, which has outperformed the majority of its peers over the past three years. Moreover, the yen might find additional support from possible intervention by Japanese authorities, similar to their actions last year when the currency’s value fell sharply. Sharef noted the BOJ’s sensitivity to the yen’s fluctuations, especially around the 150 mark against the dollar, suggesting that intervention remains a significant consideration for the central bank.

Australian Dollar holds above key level before US housing data release

Australian Dollar holds above key level before US housing data release

The Australian Dollar (AUD) continues to navigate through difficult market conditions, maintaining its stance above a significant threshold as it grapples with losses incurred on Friday. This comes in the wake of disappointing economic figures from the United States (US), which were publicized on Thursday. The apparent weakness of the AUD/USD exchange rate could be a reflection of market trepidation, potentially rooted in uncertainties surrounding the Federal Reserve’s (Fed) interest rate decisions. Nevertheless, recent softness in the US job market, alongside fresh inflation figures, seem to bolster the argument that further rate hikes by the Fed may be off the table for now.

Despite the release of positive job data from Australia, which showed an unexpected surge in employment figures for October, the AUD struggled to capitalize on these gains. The increase in employment exceeded market expectations, but a closer look revealed that the majority of these new roles were part-time, which cast a shadow over the seemingly favorable news.

The US Dollar Index (DXY), a measure of the currency’s strength against a basket of foreign currencies, experienced a lateral movement marked by a slight negative undertone. This came after a session marked by volatility that initially seemed to support the US Dollar. Yet, even in the face of weaker-than-anticipated US economic statistics and a dip in bond yields, the Dollar managed to regain some of its lost ground. Notably, the yield on the 10-year US Treasury note saw a decline, reaching a low of 4.43% on Thursday.

In the US, the number of continuing jobless claims for the week ending November 3 hit the highest point recorded for the year, standing at 1.865 million, an increase from the prior count of 1.833 million. Furthermore, initial jobless claims for the week ending on November 10 witnessed a rise to 231,000, surpassing the anticipated 220,000, marking the highest surge in nearly three months. However, there was a silver lining in the form of the Philadelphia Fed Manufacturing Survey, which indicated a less negative output at -5.9, an improvement from the previous -9.0 reading.

As the market looks forward, the release of US housing data on Friday is keenly awaited. This data is likely to shed new light on the state of the housing market and could significantly sway trading dynamics for currency pairs such as the AUD/USD. Investors and traders alike are closely monitoring these indicators as they can have substantial implications for future monetary policy and economic health assessments.

Steady Growth in Australian Employment Accompanied by a Slight Rise in Unemployment Rates

Steady Growth in Australian Employment Accompanied by a Slight Rise in Unemployment Rates

Despite a stronger-than-anticipated surge in employment for October, Australia has seen a slight uptick in its unemployment rate, suggesting that the Reserve Bank of Australia (RBA) may need to implement further measures to temper demand and curb inflationary pressures. The Australian economy saw the addition of 55,000 jobs, outstripping the predicted 24,000, with part-time roles being a significant contributor to this growth. The increase in employment, however, did not translate into a lower unemployment rate, which rose slightly to 3.7%, aligning with projections and maintaining the trend observed since the previous year, fluctuating between 3.4% and 3.7%.

The heightened unemployment rate can be attributed to an increase in the number of individuals actively seeking employment, as evidenced by the leap in the participation rate to 67%. The Australian Bureau of Statistics (ABS) has linked this outcome to the temporary employment spurred by the October 14 referendum. This phenomenon seemed to have minimal impact on market sentiments, which remained relatively stable in response to the new data.

According to Diana Mousina, the deputy chief economist at AMP Ltd., the current statistics do not strongly indicate the necessity for an immediate rate increase in the upcoming December board meeting. Nonetheless, the prospect of a rate hike in February 2024 remains, contingent on the forthcoming quarterly inflation figures. Mousina further predicts a potential weakening in the macroeconomic climate by that time.

This labor market assessment follows closely on the heels of a business survey from earlier in the week, which highlighted sustained vigor within the corporate sector. Nevertheless, it also pointed to initial signs of weakening in forward-looking indicators. Michele Bullock, the new RBA Governor, has remarked on the relaxation of the labor market, which, despite remaining robust, is no longer as constricted as it once was. This observation is corroborated by a decline in certain key indicators, such as job vacancies, which have started to retreat from previously high levels. 

In sum, the Australian labor market is displaying a complex dynamic where increased employment does not necessarily equate to reduced unemployment, due to the growing workforce participation. This situation poses a challenge for the RBA as it navigates the twin objectives of sustaining employment growth while managing inflationary pressures.

US Yields Boost Dollar, Weaken Yen

US Yields Boost Dollar, Weaken Yen

The dollar strengthened on Tuesday, driven by rising U.S. yields, putting pressure on low-yielding currencies like China’s yuan and Japan’s yen, which fell to its lowest level since 1986.

Benchmark 10-year Treasury yields increased nearly 14 basis points to 4.479% overnight. Analysts attributed this rise to expectations of Donald Trump winning the U.S. presidency, which could lead to higher tariffs and increased government borrowing.

As the dollar gained, the euro reversed part of a small rally following the first round of France’s election, which aligned with polling predictions. The euro last traded at $1.0735.

The yen dropped to 161.72 per dollar on Monday, its weakest in nearly 38 years, primarily due to the significant interest rate gap between the U.S. and Japan. On Tuesday, the yen traded at 161.55 per dollar in Asia and was under pressure from yen bears wary of potential intervention by Japanese authorities. The yen also hit a lifetime low of 173.67 against the euro on Monday and remained near that level on Tuesday.

In the bond market, the 10-year yield gap between U.S. and Japanese rates stood at 340 basis points, and nearly 440 basis points at the two-year tenor. China’s yuan, which reached a seven-month low against the dollar last week, faced similar pressure, with U.S. 10-year yields more than 220 basis points higher than Chinese government bond yields.

Robust manufacturing data in China and an announcement from the central bank about borrowing bonds, likely to sell them and stabilize falling yields, provided only a brief boost to the currency on Monday. The yuan last traded at 7.3043 in offshore markets on Tuesday, close to its June low.

The New Zealand dollar slipped 0.3% in early trade and was testing support at its 200-day moving average at $0.6075. The British pound remained steady at $1.2641. The Australian dollar hovered within its recent range at $0.6650, with traders focused on central bank minutes to gauge the likelihood of future interest rate hikes. Swaps market pricing suggests a one-in-three chance of a rate hike as soon as next month.

The question remains about the trigger for such a move. ING economist Rob Carnell noted that discussions have taken place, but the specific trigger for a hike is still uncertain. There is a leaning towards forecasting a hike at the August meeting.

Overall, the strengthening dollar and rising U.S. yields continue to exert pressure on low-yielding currencies, with markets closely watching upcoming central bank decisions and geopolitical developments.

Cryptocurrency Move Back to Support the Pack to Level

If we have a look at the bearish start to the day in the majors and the Bitcoin move back to the level by $18,500 to the support pack. The Bitcoin to USD was seemed down at the level by 1.16% on this Thursday that reversing a 1.25% gain to the Wednesday to the ended the day at the level $18,260.0. At the start of the day, the Bitcoin rose to the early morning intraday to the high at the level before hitting the reverse level.

The major resistance level goes at the level by $18,878 and the Bitcoin fell to the intraday low to the level by $17,935.0.

The close term bullish pattern stayed flawless, disregarding the most recent pullback to sub-$18,000 levels. For the bears, Bitcoin would have to slide through the 62% FIB of $10,095 to shape a close term bearish pattern.

The Bitcoin was somewhere near at the level by 1.03% to $18,072.0. A blended beginning to the day saw Bitcoin ascend to an early morning high of $18,299.0 prior to tumbling to a low of $18,070.0.

Bitcoin left the significant help and obstruction levels untested from the get-go.

Somewhere else, it was a bearish beginning to the day for the majors. The Ripple’s XRP was somewhere around at the level 2.69% to lead the route down.

Bitcoin Slips Down Below at Level $13,000 Since the Last Rally

Bitcoin Slips Down Below at Level $13,000 Since the Last Rally

The Bitcoin seems to the low at the level of $9,813 in September that managed the bitcoin to reach at the level high at $13,868. The bitcoin price is rejected to the sequential indicators on the 3-day chart.

If we have a look at the current candlestick of the 3-day chart it will seem significantly bearish and the TD sequential indicators are presented a sell signal. The 50- SMA seems down at the level of $10,600 and the 100 SMA at the level of $9,47.

The In/Out of the Money Around Price chart shows the closest and most grounded help region to be somewhere in the range of the level at $12,687 and $13,073 with near 624,000 BTC in volume. A break below this point can drive the cost of Bitcoin down to $11,914.

Despite the fact that bears appear to have assumed responsibility for the present moment, the powerful day by day upswing stays unblemished for Bitcoin. The 50-SMA and the 100-SMA harmonize around $11,200 which will go about as a critical help level. The MACD keeps bullish and the most basic obstruction level is still at $13,863. A breakout over this point can without much of a range drive the lead digital currency towards the untouched high at the level of $20,000.

Bitcoin Price Clear the Path and Rose to the Level $13,000

Bitcoin Price Clear the Path and Rose to the Level $13,000

Bitcoin Price of the bulls has been the full control of the market to the price at the level of $11,340 to $12,835. The cryptocurrency had the largest to the single day that put the gain. The MACD shows the increasing the bullish momentum to price the growth anticipated.

The position detector is a convenient little apparatus that causes us to imagine solid opposition and backing levels. According to the everyday conjunction detector, there is an absence of solid obstruction levels on the potential gain. This should be empowering news for the buyers as they plan to bring BTC into the $13,000-zone.

Santiment’s holder’s distribution charts show you the number of addresses having a place with a specific symbolic section. According to the chart, the number of addresses holding 10,000-100,000 tokens tumbled from 111 on October 8 to 104 on October 20. This is an intensely bearish sign as it shows that the whales are selling off their property.

Bitcoin buyers have the opportunity to bring the cost into the level at $13,000 and even the $14,000 interference. The everyday intersection finder shows a total absence of solid opposition barriers straightforward.

For the bears, the drawback is covered off at the $12,000-$12,100 uphold divider. A break below that zone will bring the value down to $11,000, which has both the 50-day and 100-day SMA

Cryptos Market: Bitcoin Shows Bullish Momentum Over Dollar Strength

Cryptos Market: Bitcoin Shows Bullish Momentum Over Dollar Strength

The BTC/USD traded at the level of $11,355 after the mild rejection of the top-level $11,720 that losing some of the bullish.

Ethereum USD had a similar fate at the higher risk that seeing the longer pullback than the Bitcoin. If we talk about the XRP/USD is the clear loser after breaking below the 50 SMA and the 100 SMA on the daily chart that currently trading at the level of $0.2482 after yet facing another rejection.

Bitcoin, BTC to USD, fell by 1.02% on Tuesday. Incompletely turning around a 1.55% increase from Monday, Bitcoin finished the day at the level of $11,442.0.

It was a quiet beginning to the day. Bitcoin rose to a late morning intraday high to the level of $11,574.9 before operating reverse.

Missing the mark concerning the primary significant obstruction level at $11,830, Bitcoin tumbled to an early evening intraday low of $11,333.0.

Avoiding the primary significant help level at $11,201 Bitcoin quickly returned to $11,470 levels before moving back.

The close term bullish pattern stayed perfect, upheld by the most recent move back through to $11,000 levels. For the bears, Bitcoin would need to slide through the 62% FIB of $6,400 to shape a close term bearish pattern.

Bitcoin was up by 0.22% to $11,467.0. A beginning to the day saw Bitcoin tumble to an early morning low of $11,427.0 before ascending to a high at the level of $11,467.0. Bitcoin left the support and Resistance levels untested at an early stage.

Ethereum Rate Hits at Higher Level More Profitable Than Bitcoin Mining

Ethereum Rate Hits at Higher Level More Profitable Than Bitcoin Mining

Let’s have a look at the cryptocurrency that hovering near to the level at $10,600 mark. The Bitcoin price is consolidating to the 50-12 Hour SMA and the 200-12 Hours SMA. The strong resistance lies at the level 50-12 SMA that repeatedly rejected the price.

This repeated dismissal may drop the value down to the level at  $10,400 uphold level, which is by all accounts the main observable help level on the drawback. If case this level doesn’t hold firm, at that point you can anticipate that the cost should plunge below $10,000. For this situation, one can anticipate that BTC should tumble to the level of $9,700 before it experiences another solid help.

While this may not appear to be a huge number, remember that every one of these addresses holds a great many dollars worth of Bitcoin. The fishes using the stale value activity to merge their positions look good for the general market.

With respect to the top 50 digital forms of money, the greatest failures incorporate Compound, down 12% over the most recent 24 hours, UMA down 12%, OMG Network down at the level 13%, Yearn.finance down 16%, and Aave down 18%. The main bull among the sloths of bears is EOS, which broke out greatly as covered Tuesday.

Ethereum has since September 23, been holding inside a rising equal channel. Recuperation towards $400 flamed out marginally above $360 a week ago. On the drawback, the misfortunes that followed grasped uphold at the level of $335 throughout the end of the week, permitting the shrewd agreement sign to revitalize, making strides above $350.

The Ethereum selling pressure in the market halted the increase at the 50 SMA and 100 SMA. Ether fell below the climbing channel, confirming a bear banner.

The downside of a significant help zone shows that Ethereum is at grave risk of spiraling to the level at $300. Other than the various simple help zones, the most significant one lies somewhere in the range of $298 and $309. Previously, around 879,000 locations purchased almost 2 million ETH.

Cryptocurrency Bitcoin Shows the Bullish Divergence on User Count

Cryptocurrency Bitcoin Shows the Bullish Divergence on User Count

The Bitcoin moves back and shows the bearish to the start of the day with the support level at $10,900 to the broader market.

The Bitcoin BTC to USD is rose by the level at 1.33% this Tuesday and reversing the loss at the level of 0.83% on Monday.

It was a mixed start to the day. Bitcoin fell to an early morning low $10,674.2 before finding support.

Steering clear of the major support levels, Bitcoin struck a late morning high at the level of $10,815.4 before operating reverse.

Coming up short of the major resistance levels, Bitcoin slid to a late afternoon intraday low $10,654.0.

Steering clear of the first major support level at $10,585, Bitcoin rallied to a final hour intraday high at the level of $10,889.0.

Falling short of the first major resistance level at $10,915, Bitcoin eased back to end the day at sub-$10,860 levels.

The near-term bullish trend remained whole, in contempt of the latest pullback. For the bears, Bitcoin would need to slide through the 62% FIB of $6,400 to form a near-term bearish trend. At the hour of composing, Bitcoin was somewhere around 0.28% to the level of $10,826.0. It was a blended beginning to the day. Bitcoin rose to an early morning high $10,866.0 before tumbling to a low $10,826.0.

Bitcoin started the significant help and obstruction levels untested from the get-go. Somewhere else, it was a blended beginning to the day.

Bitcoin Cash ABC (+0.54%), Bitcoin Cash SV to the level (+0.62%), and Crypto.com Coin (+0.65%) evaded the pattern right off the bat.

It was a bearish beginning to the day for the remainder of the majors, in any case. Binance Coin was somewhere around 1.18% to lead the way down.

https://xtreamforex.com/nasdaq-futures-shows-the-short/