XtremeMarkets

Trading articles

How to Trade with MetaTrader WebTrader

How to Trade with MetaTrader WebTrader: A Comprehensive Guide

In the fast-paced world of online trading, having access to a reliable and versatile platform is essential. MetaTrader WebTrader, a browser-based version of the popular MetaTrader platform, offers traders the flexibility to trade from anywhere, without the need to download or install any software. This guide will walk you through the essentials of trading with MetaTrader WebTrader, from setting up your account to executing your first trade.

Getting Started with MetaTrader WebTrader

  1. Setting Up Your Account

Before you can start trading, you need to have an account with a broker that supports MetaTrader WebTrader. If you already have a MetaTrader 4 (MT4) or MetaTrader 5 (MT5) account, you can use the same login credentials to access WebTrader.

To get started:-

  • Sign Up with a Broker: If you don’t have an account yet, choose a broker that offers MetaTrader WebTrader. Complete the registration process by providing your personal information, verifying your identity, and funding your account.
  • Access WebTrader: Once your account is set up, navigate to the MetaTrader WebTrader platform through your broker’s website. Typically, there will be a direct link to the WebTrader platform.
  1. Understanding the Interface

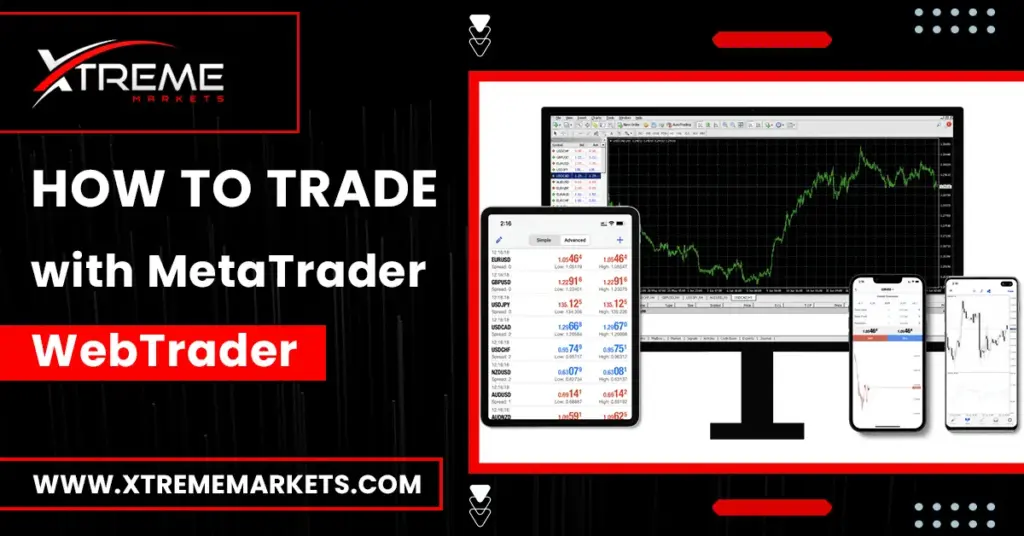
The MetaTrader WebTrader interface is user-friendly and similar to the desktop versions of MT4 and MT5. Key elements include:

  • Market Watch: This panel displays a list of currency pairs, commodities, indices, and other assets available for trading, along with their bid and ask prices.
  • Chart Window: This central area shows the price movements of the selected asset. You can customize the chart with different timeframes, indicators, and drawing tools.
  • Navigator: Here, you can access your account details, trade history, and any expert advisors (EAs) you might use.
  • Trade Panel: At the bottom of the interface, this panel shows your open trades, pending orders, and account balance.

Placing Your First Trade

  1. Choosing an Asset

To begin trading, select the asset you want to trade from the Market Watch panel. You can choose from a variety of forex pairs, commodities, indices, and more. Once you’ve selected an asset, its price chart will appear in the Chart Window.

  1. Analyzing the Market

Before placing a trade, it’s crucial to analyze the market. Use the tools available in WebTrader to conduct technical analysis:

  • Indicators: MetaTrader WebTrader offers a wide range of technical indicators, such as moving averages, RSI, MACD, and Bollinger Bands. These indicators can help you identify trends, momentum, and potential reversal points.
  • Drawing Tools: Use tools like trendlines, Fibonacci retracements, and support/resistance levels to visualize key price levels and potential trading opportunities.
  1. Placing an Order

Once you’ve conducted your analysis and decided on your trade:

  • Click ‘New Order’: This button is typically located at the top of the platform. A new order window will pop up.
  • Set Your Parameters: In the order window, you’ll need to specify the following:
    • Volume: Choose the size of your trade (e.g., 0.1 lots, 1 lot).
    • Order Type: Select ‘Market Execution’ for instant orders or ‘Pending Order’ if you want to place an order at a specific price level in the future.
    • Stop Loss and Take Profit: These are optional but highly recommended. Set your stop loss to limit potential losses and your take profit to lock in profits when the market reaches a certain level.
    • Price (for Pending Orders): If you chose a pending order, set the price at which you want your order to be triggered.
  • Execute the Trade: Once everything is set, click ‘Buy’ or ‘Sell’ to execute your trade.
  1. Managing Your Trade

After your trade is executed, it will appear in the Trade Panel. You can monitor its progress, modify your stop loss and take profit levels, or close the trade manually if needed. MetaTrader WebTrader allows you to stay on top of your trades with real-time updates and alerts.

Advanced Features of MetaTrader WebTrader

  1. Utilizing Expert Advisors (EAs)

Although WebTrader doesn’t support automated trading through Expert Advisors as extensively as the desktop versions, you can still run EAs on your desktop platform while managing and monitoring trades through WebTrader. This is particularly useful if you’re on the go but want to keep track of your automated strategies.

  1. Customizing Charts

MetaTrader WebTrader allows for extensive chart customization. You can switch between different chart types (line, bar, candlestick), adjust timeframes from 1 minute to 1 month, and save your chart templates for future use. Customizing your charts helps in maintaining consistency in your analysis and trading decisions.

  1. Risk Management Tools

Effective risk management is crucial in trading. WebTrader provides built-in tools like margin levels, equity displays, and leverage settings that help you manage your exposure. Always keep an eye on your margin level to avoid margin calls, and use stop loss and take profit orders to manage risk effectively.

Final Thoughts

MetaTrader WebTrader is a powerful tool that offers traders the flexibility to manage their trades from anywhere with an internet connection. Its intuitive interface, combined with robust analytical tools, makes it suitable for both novice and experienced traders. By understanding how to navigate the platform, analyze the markets, and manage your trades, you can leverage MetaTrader WebTrader to enhance your trading experience.

Why Reading Analyses is Essential for Trading

Why Reading Analyses is Essential for Trading

Over time, we’ve received comments questioning the necessity and usefulness of reading analyses for trading. These remarks have persisted for some time, so we’ve compiled a list of common criticisms along with responses to address each one.

  1. Why Should Traders Read Any Analysis?

Forex trading is complex, and the world is full of variables that can influence market movements. Understanding these factors is crucial for making informed decisions. For example, if a trader went long on the EUR/USD at the beginning of January, based on a long-term trend, without considering the upcoming Non-Farm Payrolls (NFP) report, they might have been caught off guard by a sudden 41-pip move. Such surprises could be mitigated by staying informed through analyses, which help traders make more educated decisions, even if they don’t guarantee success.

  1. Why Not Just Follow the News?

While following the news is important, it only provides an overview of upcoming events without delving into potential market reactions. An analysis offers deeper insights into how events might unfold and their possible impact on the market. For instance, reading an analysis could have helped the trader mentioned earlier better understand market dynamics and protect their investments more effectively.

Analyses save traders time by distilling complex information into concise, actionable insights, allowing them to focus more on trading rather than sifting through news and data.

  1. Should Traders Only Focus on Daily Events?

Limiting yourself to daily events might not capture the broader market trends. Markets often price in long-term developments well before they fully materialize. For instance, if a trader had read about the potential impact of declining US corporate profits due to trade tensions back in October, they might have anticipated or responded more effectively to the subsequent stock market decline. Analyses provide context for making more informed decisions, rather than just reacting to immediate news.

  1. If Analysts Don’t Provide Specific Buy/Sell Advice, Why Bother Reading?

The purpose of analysis is not to dictate specific trades but to offer insights and ideas. Traders should use these insights to make their own decisions based on their strategies and risk tolerance. An analysis that suggests the US economy might enter a recession, for example, could lead to various trading strategies—shorting the Dollar, going long on the Yen, or other options. The key is for traders to use the information to develop their strategies rather than rely on predefined recommendations.

  1. Why Don’t Analysts Trade if They’re So Knowledgeable?

Professional analysts are often restricted from trading to avoid conflicts of interest. This separation ensures that their analyses are objective and not influenced by personal gain. Analysts focus on identifying opportunities, while portfolio managers execute trades based on those insights. This division of labor allows for more focused and profitable decision-making.

  1. Why Should Scalpers Care About Analysis?

Even scalpers, who trade on very short timeframes, can benefit from understanding broader market dynamics. For instance, a sudden market move following an NFP report can affect even the shortest trades. By understanding the potential impact of news and data releases, scalpers can manage their risk more effectively and make more informed decisions.

  1. What If I Don’t Believe in Technical Analysis?

While technical analysis may not resonate with everyone, it has proven useful for many traders. Independent studies suggest that strategies based on technical analysis can help outperform the market. While it requires time, patience, and practice, technical analysis can provide valuable insights into market timing and trade management, even for those who primarily focus on fundamental factors.

  1. Why Bother with Fundamental Analysis?

Fundamental analysis helps traders understand the underlying economic conditions driving market movements. It allows traders to answer the “why” behind their trades, rather than just following a set of rules. Fundamental analysis is particularly important for understanding interest rates, which can affect swap rates and overall market sentiment. Even for short-term traders, fundamental analysis provides context for how economic data might influence market behavior.

  1. Why Follow Your Analysis Over Others?

We’re not suggesting that our analysis is the only source to follow, but rather that traders should seek out reliable, up-to-date analysis that aligns with their interests and trading style. Just as people diversify their news sources, it’s beneficial to consult multiple analyses to gain different perspectives. We encourage you to give our analysis a try and see how it complements your trading strategy.

Top 8 Chart Patterns Every Trader Should Know

Top 8 Chart Patterns Every Trader Should Know

Introduction:-
Chart patterns are specific formations on a price chart that can predict future price movements. Technical analysis operates on the principle that history tends to repeat itself, and certain chart patterns have demonstrated a high probability of predicting specific price movements. These patterns are generally classified into two categories:

  1. Continuation patterns: – which signal a continuation of the current trend.
  2. Reversal patterns: – which signal a potential reversal of the current trend.

Part 1: Reversal Patterns

  1. Head and Shoulders:- The Head and Shoulders pattern is a reversal chart pattern that suggests a trend change is imminent. It consists of three peaks: a higher peak (the head) between two lower peaks (the shoulders). A break below the neckline, which connects the two shoulders, is considered a sell signal. The price target is calculated by measuring the distance from the head to the neckline and projecting it downward. When this pattern appears during a downtrend, the inverse version is known as the Inverse Head and Shoulders pattern.
  2. Double Top and Double Bottom:- The Double Top and Double Bottom patterns are classic reversal patterns that occur during uptrends and downtrends, respectively. A Double Top forms when the price reaches a high point twice without breaking through, signaling potential trend reversal. A sell signal is triggered when the price breaks below the support line, with a target price set by measuring the distance between the top and the support line. Conversely, a Double Bottom signals a potential upward reversal, with the buy signal triggered by a break above the resistance line.
  3. Triple Top and Triple Bottom:- Triple Top and Triple Bottom patterns are similar to the Double Top and Double Bottom patterns but involve three peaks or troughs instead of two. They are also reversal patterns, and the trigger signals occur when the price breaks through the support or resistance lines. The target prices are calculated similarly, by measuring the distance between the top and the support line (for Triple Tops) or the bottom and the resistance line (for Triple Bottoms).
  4. Rounding Top:- The Rounding Top pattern takes longer to form and represents a gradual shift in market sentiment from bullish to bearish. This pattern forms a rounded shape on the chart, and the sell signal is triggered by a break below the support line. The price target is the distance from the top of the formation to the support line.

Part 2: Continuation Patterns

Continuation patterns suggest that the existing trend is likely to continue after a period of consolidation. These patterns are particularly useful for trend-following traders. Let’s explore some of the most popular continuation patterns:

  1. Rectangles:- A rectangle is a continuation pattern that indicates the trend will likely resume after a period of sideways trading. It can be bullish or bearish, depending on the underlying trend. In a bullish rectangle, the price consolidates sideways during an uptrend, and a breakout above the rectangle’s upper line signals a continuation of the uptrend. For bearish rectangles, the pattern forms during a downtrend, and a breakout below the lower line signals the trend will continue downward. The price target is typically the height of the rectangle.
  2. Wedges:- Wedges are continuation patterns that form as the price trades within converging trendlines. A bullish wedge forms during an uptrend, with the price gradually narrowing as sellers try to push it lower but fail to overpower the buyers. A breakout above the upper trendline signals a continuation of the uptrend. Bearish wedges work similarly but occur during downtrends, with the breakout below the lower trendline signaling a continuation of the downtrend. The target price is the wedge’s maximum height projected from the breakout point.
  3. Flags:- Flags are continuation patterns characterized by parallel trendlines that slope against the prevailing trend. A flagpole forms as the price moves sharply in one direction before entering a consolidation phase (the flag). A breakout above the flag in a bullish flag pattern signals the resumption of the uptrend, with the target price calculated as the height of the flagpole projected from the breakout point. Bearish flags work similarly but occur during downtrends.
  4. Triangles:- Triangles can be ascending, descending, or symmetrical and are common continuation patterns. Ascending triangles have a flat upper trendline, while descending triangles have a flat lower trendline. Symmetrical triangles have converging trendlines that neither slope up nor down. A breakout from the triangle pattern, whether upward or downward, signals the resumption of the prevailing trend. The target price is typically the height of the triangle projected from the breakout point.
Conclusion

This article aimed to provide insight into some of the most important chart patterns that every trader should know. These patterns can help you identify potential trend directions, but they should not be relied upon in isolation. While I’ve covered the top 8 chart patterns, if you believe I’ve missed any crucial ones, feel free to share them in the comments. As always, remember that no indicator or trading system guarantees success. It’s essential to find what works best for you and stick to it.

5 Key Forex News Events You Should Follow

5 Key Forex News Events You Should Follow

In the fast-paced world of currency markets, where significant movements can occur without warning, it’s crucial for new traders to understand the various economic indicators and forex news events that influence the markets. Quickly identifying which data to watch, understanding its implications, and learning how to trade based on this information can significantly enhance a trader’s profitability and pave the way for long-term success.

While trading technical chart patterns can be lucrative, it’s essential to remain aware of the underlying fundamental factors driving the markets. Below, we’ve outlined five of the most important news releases and economic indicators you should know about.

Top 5 Key Forex News Events

  1. Central Bank Rate Decisions

Every month, central banks from the world’s major economies convene to determine interest rates. Their decision—to maintain, raise, or lower rates—has a profound impact on the economy’s currency and, consequently, on traders. Typically, an interest rate increase is bullish for a currency (increasing its value), while a decrease is bearish (decreasing its value). An unchanged decision can also move markets depending on the economic context.

The significance of rate decisions extends beyond the announcement itself; the accompanying policy statement provides valuable insights into the central bank’s economic outlook and future monetary policy. This includes potential actions such as the implementation of Quantitative Easing (QE), which is covered in detail in our Forex Mastercourse.

For example, following the ECB’s decision to cut the Eurozone rate to 0.05% in September 2014, EUR/USD dropped by over 2,000 pips.

  1. GDP (Gross Domestic Product)

Gross Domestic Product is a key indicator of a country’s economic health. Central banks set growth targets measured by GDP, and deviations from these targets can influence currency values. When GDP figures fall short of expectations, the currency typically declines; conversely, when GDP exceeds expectations, the currency tends to rise. This data is closely monitored by traders as it can hint at future central bank actions.

For instance, when Japan’s GDP unexpectedly contracted by 1.6% in November 2014, the Japanese Yen fell sharply against the U.S. Dollar as traders anticipated further central bank intervention.

  1. CPI (Consumer Price Index)

The Consumer Price Index is the most widely used measure of inflation, reflecting the average price changes paid by consumers for a basket of goods. Central banks use this data to guide interest rate and policy decisions. If inflation exceeds a certain target, interest rate hikes are often implemented to curb rising prices.

In November 2014, Canada’s CPI exceeded market expectations by rising to 2.3%, which led to the Canadian Dollar reaching a six-year high against the Japanese Yen.

  1. Unemployment Rate

The unemployment rate is a critical economic indicator that central banks monitor closely. Higher employment levels often lead to interest rate hikes as central banks seek to balance inflation with economic growth. This data attracts significant attention from traders, particularly in the form of the U.S. ADP and Non-Farm Payroll (NFP) reports, released monthly. The NFP report is especially influential, and we provide a monthly preview and analysis to help you trade it effectively.

ADP data, released before the NFP, is often used as a predictive tool for the latter.

  1. FOMC Meetings

While all central bank meetings are important, the U.S. Federal Open Market Committee (FOMC) meetings are particularly significant given the U.S. Dollar’s status as the world’s reserve currency. During these meetings, the committee sets interest rates, assesses current economic conditions, and provides guidance on future monetary policy. The committee’s statements are scrutinized by traders for clues about future rate decisions, with even subtle language changes having the potential to trigger significant market movements.

For example, during the March 18th, 2015 meeting, EUR/USD spiked by 400 pips in minutes as the market perceived the meeting’s outcome as negative for the U.S. Dollar.

These meetings are also where changes in monetary policy, such as the announcement of quantitative easing, are revealed—crucial information for currency traders. Since the ECB announced its latest QE program on January 22nd of this year, EUR/USD has fallen by over 600 pips.

Conclusion

Understanding economic indicators and news releases isn’t just about knowing what the data means—it’s about anticipating market reactions and capitalizing on trading opportunities. For new traders, navigating the volatility and uncertainty of news-driven markets can be challenging. However, with the right tools and knowledge, you can turn these events into profitable trading opportunities.

What is a Forex Trading Robot or Forex Expert Advisor?

What is a Forex Trading Robot or Forex Expert Advisor?

In the fast-paced world of forex trading, staying ahead can be challenging. That’s where forex trading robots, also known as Forex Expert Advisors (EAs), come into play. These automated systems are designed to help traders execute trades with precision and efficiency. But what exactly are they, and how can they benefit you? Let’s dive in.

Understanding Forex Trading Robots

Firstly, forex trading robots are software programs that use algorithms to automate trading decisions. These robots analyze market data, including price movements, trends, and signals, to identify trading opportunities. They can then execute trades on your behalf, without the need for manual intervention. This automation can be particularly useful in the forex market, which operates 24 hours a day, five days a week.

Benefits of Using Forex Trading Robots

One of the primary benefits of using forex trading robots is that they can remove the emotional element from trading. Emotions like fear and greed can often lead to poor decision-making. A robot, however, sticks to its programmed rules and executes trades based purely on data.

Moreover, these robots can work tirelessly, monitoring the market and executing trades around the clock. This ensures that you don’t miss out on potential trading opportunities, even while you sleep.

Additionally, forex trading robots can help in managing multiple trading strategies simultaneously. For example, you might want to use one strategy for trending markets and another for ranging markets. A well-designed robot can handle these complexities with ease.

How Do Forex Expert Advisors Work?

Forex Expert Advisors (EAs) are typically integrated with trading platforms like MetaTrader 4 or MetaTrader 5. Once installed, they can analyze market conditions and place trades according to predefined criteria. These criteria can include various technical indicators, such as moving averages, RSI, and MACD.

Furthermore, you can customize these EAs to match your trading preferences. Whether you prefer a conservative approach or a more aggressive strategy, you can tweak the settings to suit your needs.

Demo Trading Online

If you’re new to using forex trading robots, we recommend starting with demo trading online. This allows you to test the robot in a risk-free environment using virtual money. By doing so, you can observe how the robot performs under different market conditions and fine-tune its settings without any financial risk.

Choosing the Right Forex Trading Company

When it comes to choosing a forex trading company, it’s crucial to go with one that offers reliable and efficient trading robots. At Xtreme Markets, we allow  expert advisors designed to enhance your trading experience. 

Why Xtreme Markets?

At Xtreme Markets, we understand the importance of having the right tools at your disposal. Forex trading robots are designed to help you achieve your trading goals with minimal effort. We offer comprehensive support to help you get the most out of your trading robot, from installation to optimization.

Moreover, we prioritize transparency and reliability. You can trust that our trading robots are developed with the highest standards, ensuring they perform as expected.

Final Thoughts

Forex trading robots or Forex Expert Advisors can be a valuable addition to your trading arsenal. They offer numerous benefits, from eliminating emotional trading to working around the clock. However, it’s essential to choose the right forex trading company to ensure you get a reliable and effective trading robot. At Xtreme Markets, we are committed to providing you with the best tools and support to succeed in the forex market. So, why not give our expert advisors a try? Start with demo trading online and experience the difference for yourself.

What is the Fastest Way to Learn Forex?

What is the Fastest Way to Learn Forex?

Forex trading can be an exciting and profitable venture if you know how to navigate the market effectively. However, before diving in, it’s crucial to equip yourself with the right knowledge and skills. Here’s a guide on the fastest way to learn forex trading.

Start with the Basics

First and foremost, you need a solid foundation in forex education. Understanding the basics is essential before moving on to more complex concepts. Begin with learning what forex trading is, how the market operates, and the key terminologies. There are plenty of online resources, including articles, videos, and e-books, that explain these concepts in simple language.

Enroll in a Course

One of the quickest ways to learn forex trading is to enroll in a structured course. Many platforms offer comprehensive forex education courses designed for beginners. These courses cover everything from the basics to advanced trading strategies. Furthermore, they often include quizzes and practical exercises to test your understanding and reinforce learning.

Use Demo Accounts

Practicing with a demo account is a highly effective method for learning forex trading quickly. At Xtreme Markets, we offer demo accounts where you can trade with virtual money. This allows you to practice trading in real market conditions without any financial risk. Moreover, it helps you become familiar with the trading platform and tools.

Learn from Experts

Listening to and learning from experts in the field can accelerate your forex education. Many successful forex traders share their knowledge and strategies through blogs, webinars, and social media channels. Following these experts can provide you with valuable insights and tips that you won’t find in textbooks.

Join Forex Communities

Another way to speed up your learning process is to join forex trading communities. These can be found on forums, social media groups, or dedicated websites. In these communities, you can ask questions, share experiences, and get advice from fellow traders. Additionally, being part of a community helps you stay motivated and up-to-date with the latest trends and news in the forex market.

Practice Regularly

Consistency is key when learning forex trading. Make it a habit to practice trading regularly, even if it’s just for a short period each day. The more you practice, the more confident and skilled you will become. In addition, practicing regularly helps you develop your trading strategies and improves your decision-making abilities.

Analyze Your Trades

After each trading session, take the time to review and analyze your trades. Look at what went right and what went wrong. Understanding your mistakes and learning from them is crucial for improvement. Furthermore, keeping a trading journal can be very helpful. Write down your trades, the reasons behind them, and the outcomes. This will help you identify patterns and areas for improvement.

Stay Informed

Staying informed about the latest developments in the forex market is vital for any trader. Thus, follow financial news, read market analysis, and keep an eye on economic indicators. This knowledge will help you make better trading decisions and stay ahead of market trends.

Seek Feedback

Getting feedback from more experienced traders can provide you with different perspectives on your trading strategies. Therefore, don’t hesitate to ask for feedback and advice. Constructive criticism can help you refine your approach and avoid common pitfalls.

Stay Patient and Persistent

Lastly, remember that learning forex trading is a journey. It takes time, effort, and patience. Stay persistent, and don’t get discouraged by setbacks. The more you learn and practice, the better trader you will become.

In conclusion, the fastest way to learn forex trading involves a combination of structured education, practical experience, and continuous learning. At Xtreme Markets, we offer a range of educational resources and demo accounts to help you on your journey. By following these steps and dedicating yourself to your forex education, you’ll be well on your way to becoming a successful forex trader.

How to Determine Trends on Forex Market

How to Determine Trends on Forex Market

The Forex market can be a confusing place, with all the numbers and charts flying around. But if you want to be successful in trading, you need to be able to determine trends. In this blog, we’ll break down how you can spot trends on the Forex market using simple techniques that anyone can understand.

What are trends?

Trends are the general direction in which a market or an individual asset is moving over time. In the Forex market, trends can be going up (bullish), going down (bearish), or moving sideways (range-bound). Thus, being able to identify these trends can help you make better trading decisions.

Look at the charts

The first step in determining trends on the Forex market is to look at the charts. Charts are graphical representations of price movements over time. By looking at these charts, you can see patterns and trends that can help you predict future price movements.

One of the easiest ways to spot trends is to look at the moving averages. Moving averages are lines that represent the average price of a currency pair over a certain period of time. If the price is above the moving average line, it indicates an uptrend. On the other hand, if it’s below the line, it indicates a downtrend.

You can also use trend lines to determine trends. Trend lines are lines drawn on a chart that connect two or more price points. If the trend line is moving up, it indicates an uptrend. If it’s moving down, it indicates a downtrend.

Pay attention to momentum

Momentum is another important factor to consider when determining trends on the Forex market. Momentum refers to the speed at which prices are moving in a certain direction. If prices are moving rapidly in one direction, it indicates a strong trend.

You can use indicators like the RSI (Relative Strength Index) or MACD (Moving Average Convergence Divergence) to measure momentum. These indicators can help you identify whether a trend is likely to continue or reverse.

Keep an eye on the news

Another way to determine trends on the Forex market is to pay attention to the news. Market-moving events like economic reports, political developments, and central bank announcements can all impact currency prices and create trends.

For example, if a country’s central bank announces an interest rate hike, it can cause the currency to strengthen, leading to an uptrend. On the other hand, if there’s political instability in a country, it can cause the currency to weaken, leading to a downtrend.

Practice makes perfect

Like any skill, spotting trends on the Forex market takes practice. It’s important to spend time looking at charts, analyzing price movements, and keeping up with the news. The more you practice, the better you’ll become at identifying trends as well as making profitable trades.

Conclusion

Determining trends on the Forex market is essential for any successful trader. By looking at charts, paying attention to momentum, and keeping an eye on the news, you can improve your ability to spot trends and make informed trading decisions. With practice and patience, you can become a successful Forex trader.

Remember, our broker Xtreme Markets is here to help you navigate the Forex market and make profitable trades. Don’t hesitate to reach out to us for expert advice and support. Happy trading!